Figure 6.
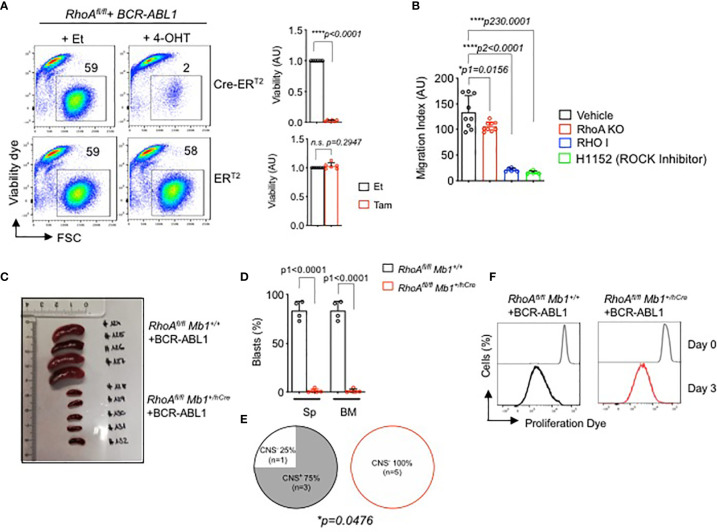
RHOA is required for BCR-ABL1-induced pre-B cell transformation. (A) RhoAfl/fl pre-B cells were transformed with BCR-ABL1 and were then transduced with Cre-ERT2. Cells were treated with either 4-OHT to induce Cre expression, or with Et. Left- The percentage of living cells were determined by flow cytometry using Sytox as an excluding dead cell stain. Right- quantification of the percentage of living cells after 3 days of tamoxifen induction relative to control cell. N=6 independent samples per group, and error bars represent mean ± SD. AU: arbitrary unit. (B) RhoAfl/fl -BCR-ABL1 transformed cells were treated with RHO inhibitor (RHO I, 2µg/ml), H1152 (ROCK inhibitor H1152, 5µM) or with vehicle for 16 hours, then were subjected to migration gradient toward CXCL12 (100ng/ml) for 16 hours. RhoAfl/fl Mb1+/hCre -BCR-ABL1+ cells were also used for migration assay. The cells that migrated in the lower chamber were counted by trypan blue. (C, D). RhoAfl/fl and RhoAfl/fl Mb1+/hCre pre-B cells were transformed with BCR-ABL1 and were then injected intravenously into immunodeficient RAG2-/- γc-/- mice. The mice were sacrificed after three weeks when the control mice showed leukemic symptoms. (C) Spleen (Sp) size. (D) Quantification of total number of BCR-ABL1+ cells in the Sp and bone marrow (BM). (E) CNS-infiltration as assessed by semi-quantitative scoring (D, E). Statistical significance was determined using unpaired t-test, two-tailed. (F) In vitro proliferation of the RhoA-deficient transformed cells recovered from the bone marrow of the RAG2-/- γc-/- mice (C, D). The cells were cultured for 1 week and labelled with a proliferation dye. Cells were analyzed by flow cytometry directly after the labelling (Day 0) and after 3 days (Day 3). One representative experiment is shown. RhoAfl/fl Mb1+/+ (N=4), RhoAfl/fl Mb1+/hCre (N=5). *p<0.05, ****p<0.0001, ns, not significant.

