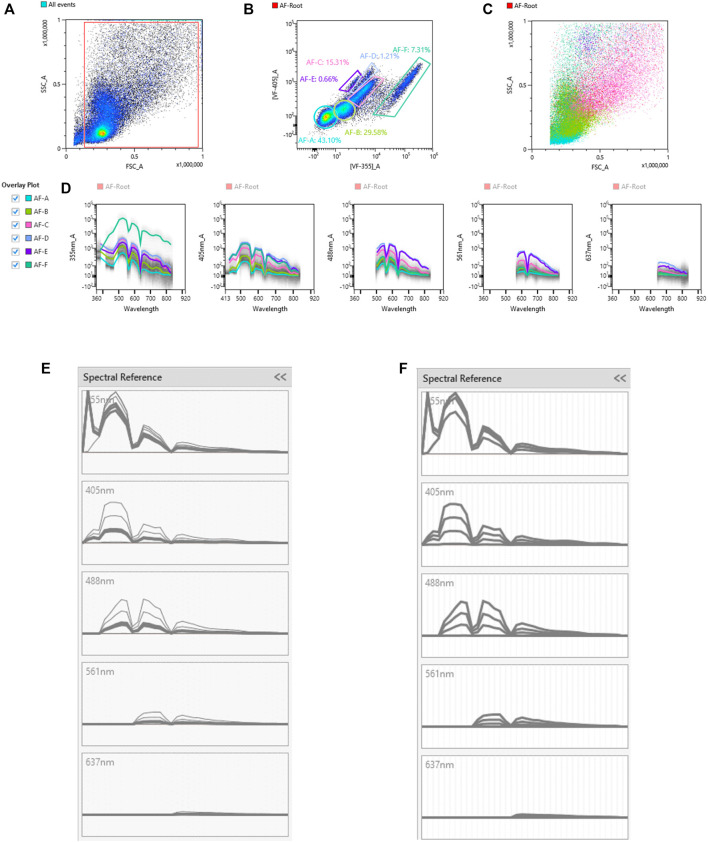
FIGURE 1.
Identification of unique autofluorescent populations in an unstained sample using autofluorescence finder tool. The unstained sample with no unmixing applied was loaded into the autofluorescence (AF) Finder tool. The AF-Root gate was created to distinguish events used in the analysis from the debris (A). Virtual filters in the violet range (VF-405; y-axis) and ultraviolet range (VF-355; x-axis) were used to view the events from the AF-Root gate. Populations that separate were gated as possibly unique AF populations (B). The scatter plots (C) as well as spectral traces (D) for these AF populations were displayed. The spectral trace for each AF population was overlaid and evaluated to determine which AF populations were unique. The spectral traces for populations A, B, and C [bolded traces in (panel E)] were determined to be nearly identical. Since these traces are the same, only one of these populations was used in the spectral unmixing. Populations A, D, E, F [bolded traces in (panel F)] were unique AF spectra and each was used in the spectral unmixing.

