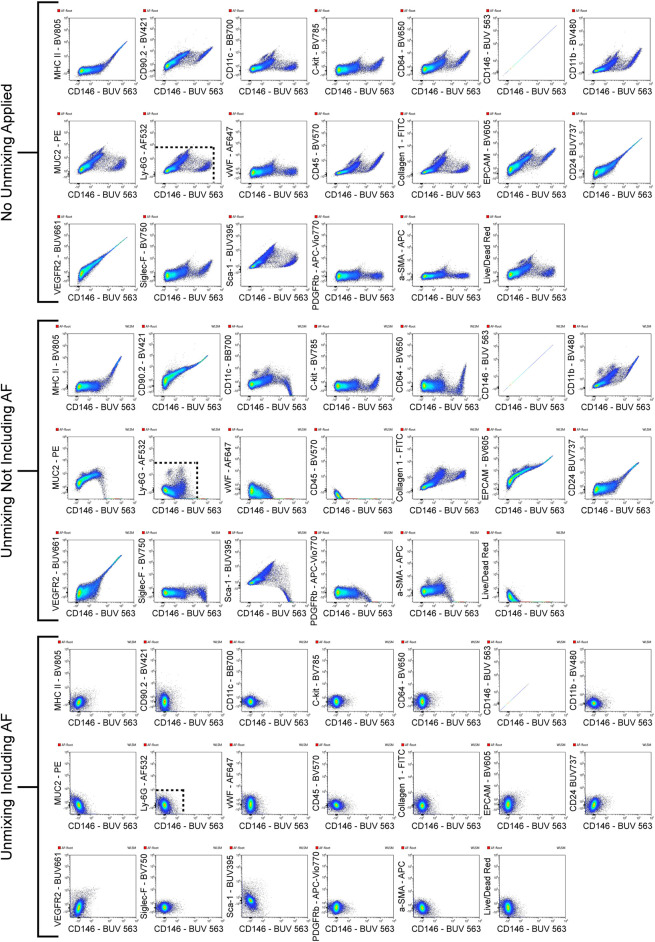
FIGURE 2.
Improved resolution of unstained sample with AF included in unmixing. The unstained sample was viewed with CD146-BUV563 on the x-axis vs. every fluorescent parameter in the panel on the y-axes. Three sets of these plots are shown: the unstained sample with no unmixing applied, the unstained sample with unmixing applied but no AF populations included in the unmixing, and the unstained sample with unmixing applied and each unique AF population (AF-A, AF-D, AF-E, and AF-F) included in the unmixing. Dotted lines in the CD146-BUV563 vs. Ly-6G–AF532 plot shows how the resolution improves with unmixing and unmixing with AF included. From the plots with no unmixing applied to the plots with unmixing applied and AF included, several decades in the dynamic range are preserved.

