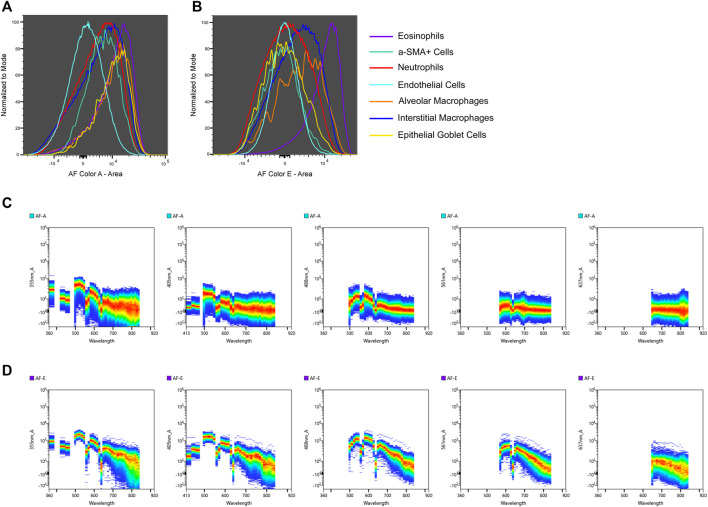
FIGURE 3.
AF signature tracing to a specific cell type. The intensities of two unique AF signatures, AF color A (A) and AF color E (B), are shown for cell types identified by immunophenotyping. AF color E is more intense in eosinophils compared to other cell types. Spectral plots of the unstained sample for AF color A (C) and AF color E (D) are shown to compare in which regions of the spectrum these AF signatures emit [wavelength (x-axis) is in nm]. AF color E has a distinct emission in the yellow-green region of the spectrum (500–550 nm) which is indicative of flavins. The intense presence of AF color E in eosinophils and AF color E having emission in the spectral region of flavins links AF color E to eosinophils.

