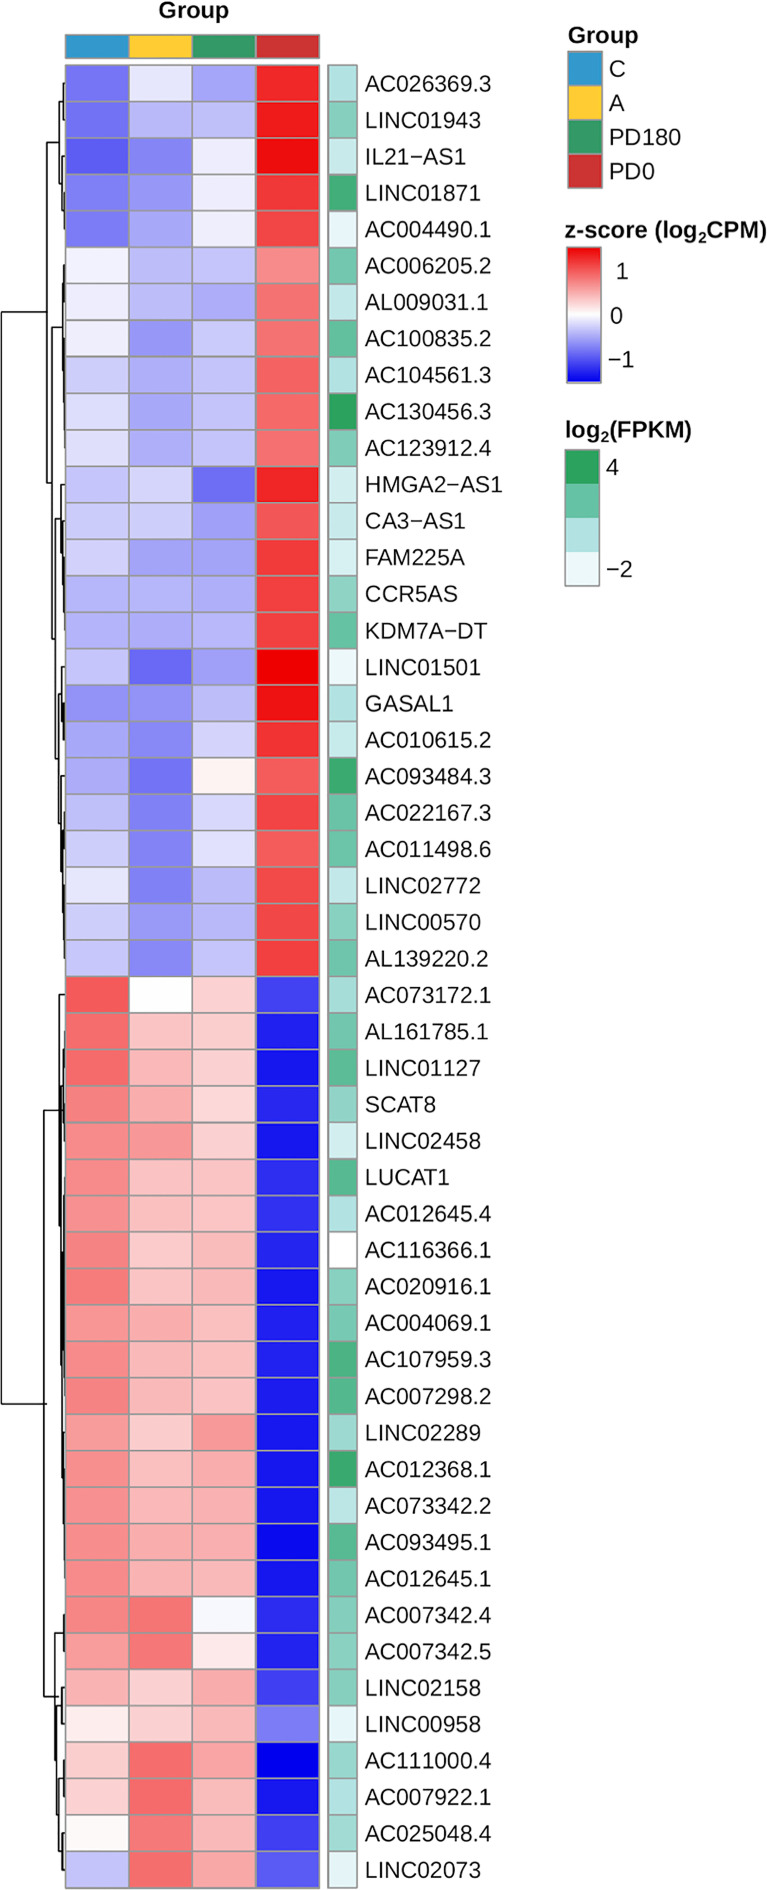
Figure 6.
Heatmap of the expression profiles of the top 20 lncRNAs expressed in VL patients (PD0). The top selection retrieved those genes within the dataset of 147 primarily selected DE lncRNAs ( Supplementary Table 2 ) based on ranking of statistical significance (FDR values) followed by fold regulation (log2FC values). Gene expression regulation by group is represented by the z score of the cpm read count, and the transition color scale from red to blue indicates up- and downregulation, respectively. Gene expression level is represented by mean FPKM values at the side (green heatmap column), where color intensity toward dark green indicates increasing levels (highly expressed lncRNAs).

