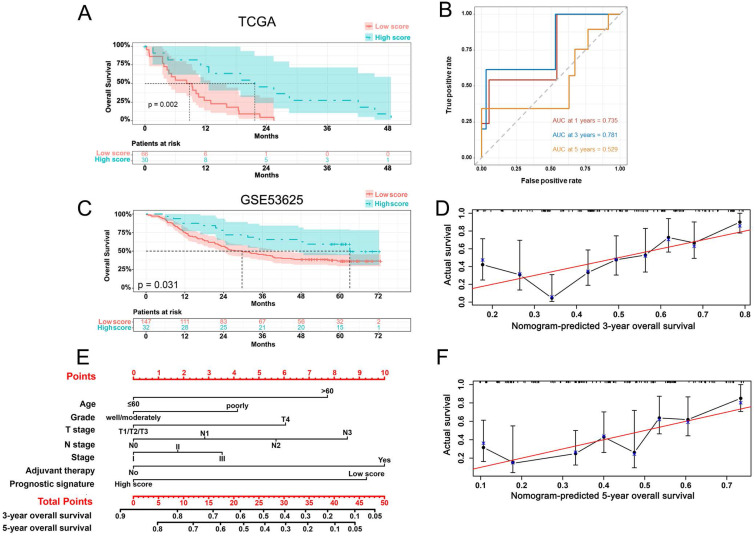
Figure 3.
Kaplan-Meier curve (A) and AUC of time-dependent ROC curves (B) of ESCC patients in the low and high score group based on the TCGA database and Kaplan-Meier curve (C), nomogram (E) and calibration plots (D, F) of ESCC patients from the GSE53625 dataset.

