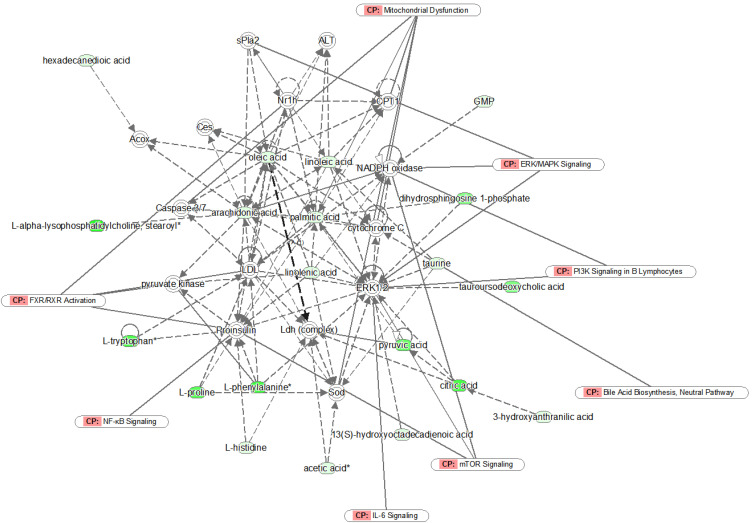
Figure 4.
Network analysis of the identified metabolites by IPA. Green symbols represent downregulated metabolites in unresectable PDAC patients; CP represents canonical pathways that are related to the identified specific metabolites. Solid lines represent a direct relationship between molecules, while dotted lines represent indirect relationships.

