
FIGURE 2.
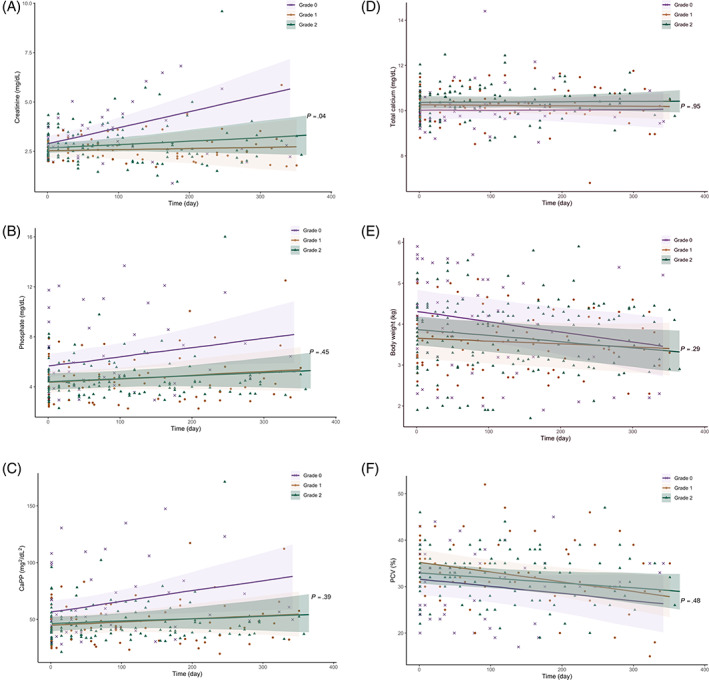
Scatter plots illustrating the linear change of (A) creatinine, (B) phosphate, (C) CaPP, (D) total calcium, (E) bodyweight, and (F) PCV in CKD cats grouped according to the severity of nephrocalcinosis (“grade 0” vs “grade 1” vs “grade 2”) during the first 365 days after transition to a phosphate‐restricted diet. The solid lines represent the regression lines and the shaded areas represent 95% confidence interval (95% Cl) for the fitted linear regression. The P‐values shown are the interactions among groups and the rate of change for these analyses within groups are presented in Table S1