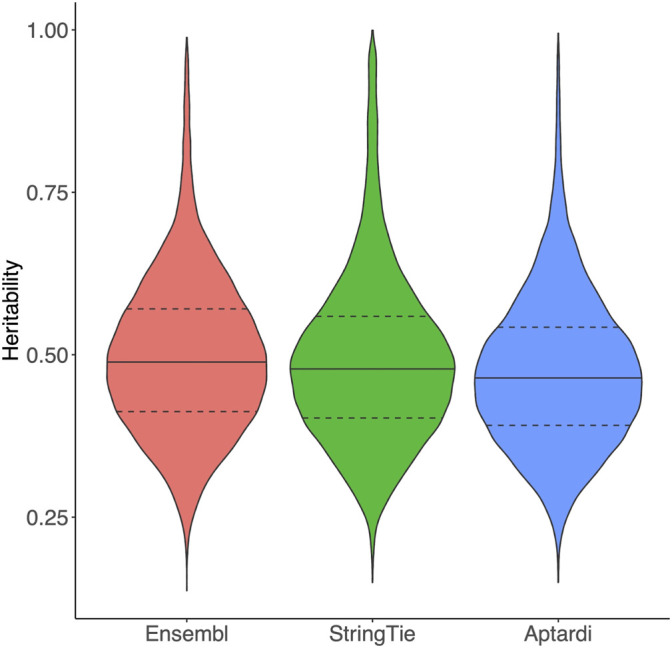
FIGURE 1.

Heritability of transcripts in the detected above background transcriptome. Heritability of transcripts derived from the Ensembl reference annotation, StringTie, and aptardi. Heritability was estimated as the coefficient of determination (R2) from a one-way ANOVA of individual rat expression values using strain as the predictor (30 strains total) and transcript normalized expression estimates as the response. The solid horizontal line within each violin plot represents the median heritability for that group of transcripts. The dashed horizontal lines represent the upper quartile and lower quartile heritabilities for that group of transcripts.
