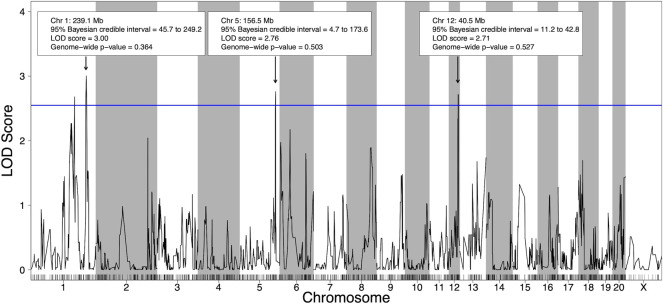
FIGURE 2.
Quantitative trait loci (QTL) for voluntary alcohol consumption in the HXB/BXH recombinant inbred panel. Strain means were used in a marker regression to determine phenotypic QTL. The blue line represents the logarithm of the odds (LOD) score threshold for a suggestive QTL (genome-wide p-value = 0.63). Suggestive QTL are labeled with their location, 95% Bayesian credible interval, LOD score, and genome-wide p-value. Empirical genome-wide phenotypic QTL p-values were calculated using 1,000 permutations.

