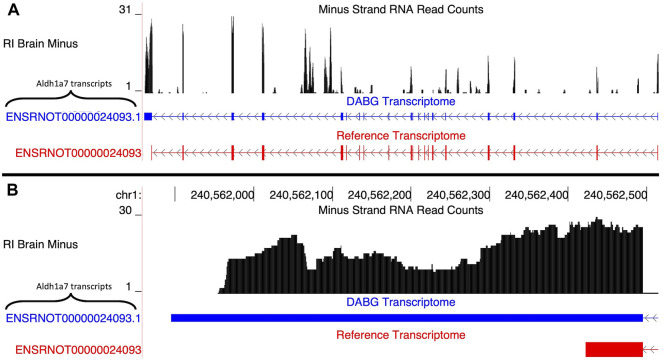
FIGURE 4.
Isoforms of the Aldh1a7 gene. (A) The blue transcript represents those identified in the detected above background (DABG) transcriptome, and the red transcript represents the transcript present in Ensembl reference annotation. ENSRNOT00000024093 is annotated in the Ensembl reference transcriptome but was filtered out of the DABG transcriptome. ENSRNOT00000024093.1 represents a novel isoform identified by aptardi. (B) Detailed view of the 3′ region comparing aptardi annotation (ENSRNOT00000024093.1) to Ensembl reference annotation (ENSRNOT00000024093). ENSRNOT00000024093 and ENSRNOT00000024093.1 differ only in the length of their 3′ most exon. The RNA sequencing reads on the negative strand (black plot) represent a 10% randomly sampled subset from the HXB/BXH recombinant inbred rat panel RNA sequencing data in brain. This image was generated using the UCSC Genome Browser (Kent, 2002).

