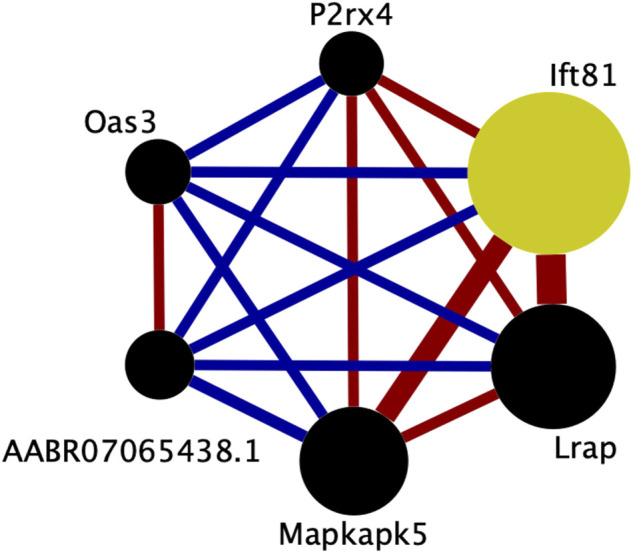
FIGURE 5.

Connectivity within the brain candidate coexpression module for predisposition to voluntary alcohol consumption. Each circle represents a transcript from the coexpression module. The size of each circle is weighted based on its intra-modular connectivity (not to scale), and the thickness of each edge is weighted based on the magnitude of the connectivity between the two transcripts (not to scale). The edge colors indicate the direction of the connectivity (red = positive, blue = negative). Transcripts are ordered by intra-modular connectivity clockwise starting with Ift81. Strain mean normalized transcript expression estimates were used in weighted gene coexpression network analysis to generate coexpression modules. This figure was generated using Cytoscape (v. 3.8.2) (Shannon et al., 2003).
