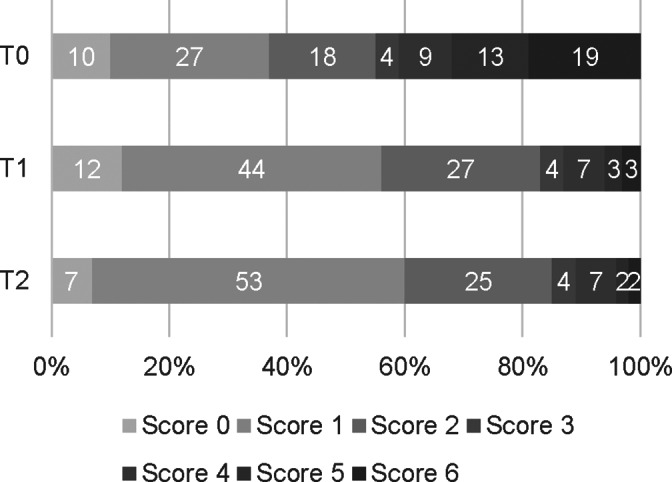
FIGURE 2.

Chest radiographs scores according to the CXR‐CAPS, as described in Table 2, at each time point. Percentage of regions with different CXR scores according to the CXR‐CAPS at admission (T0, n = 17, 306 regions), 2 weeks (T1, n = 13, 234 regions), and 1 month (T2, n = 6, 108 regions) after diagnosis
