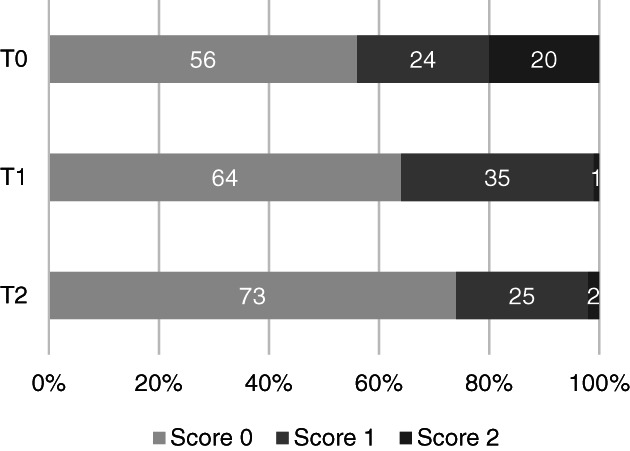
FIGURE 5.

Percentage of regions classified as showing no lesions (score 0), B‐lines (score 1), or lung consolidation (shred sign or air/fluid bronchogram, score 2) according to the LUS‐sCAPS at admission (T0) (n = 17, 306 regions), 2 weeks after diagnosis (T1) (n = 13, 234 regions), and 1 month after diagnosis (T2) (n = 6, 108 regions)
