TABLE 5.
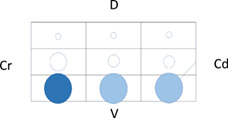
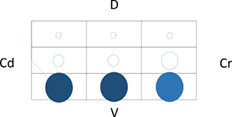
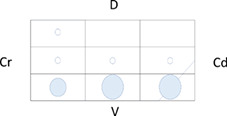
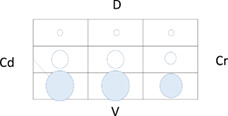
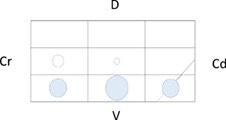
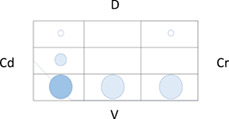
Distribution of LUS findings on the right and left hemithorax, according to the LUS‐CAPS at the different time points
| Left | Right | |
|---|---|---|
|
T0 n = 17 |
|
|
|
T1 n = 13 |
|
|
|
T2 n = 6 |
|
|
Note: Median lesion severity score according to the LUS‐CAPS in each region corresponds to the color grading of the circles ranging from 0 to 6  . The 5 different circle sizes correspond to a percentage range of dogs showing lesions in that region (1%‐20%; 21%‐40%; 41%‐60%; 61%‐80%; 81%‐100%). The absence of any circle indicates that no dogs had any lesion on that region at that time point.
Abbreviations: CAPS, canine aspiration pneumonia score; Cd, caudal; Cr, cranial; D, dorsal; LUS, lung ultrasound; T0, admission; T1, 2 weeks after diagnosis; T2, 1 month after diagnosis; V, ventral.
