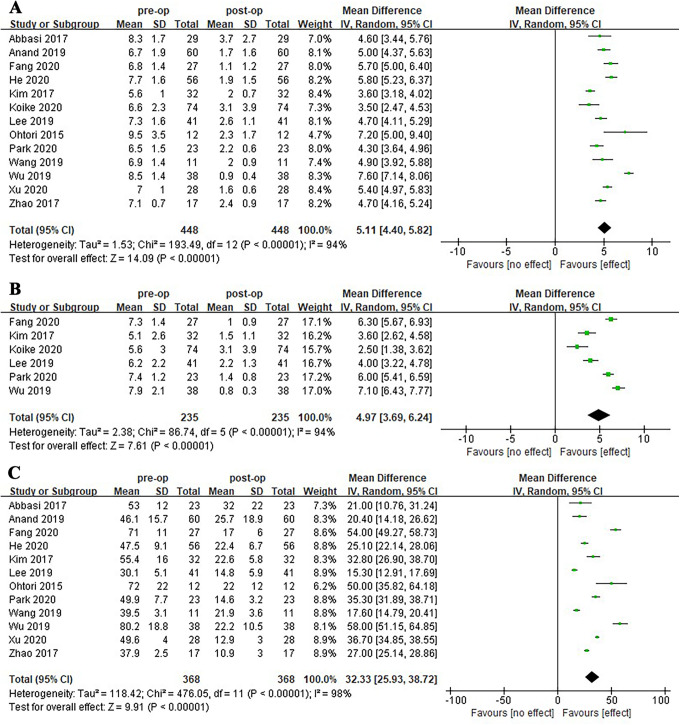
Figure 2.
Forest plots of VAS-back pain (A), VAS-leg pain (B) and ODI (C). The vertical line indicates no change in the outcome after OLIF surgery. The position of the black diamond indicates whether there is any change and improvement or deterioration depends on whether it is on the effect side or the no effect side. The squares indicate the individual studies with their size proportional to the weightings given to each study.

