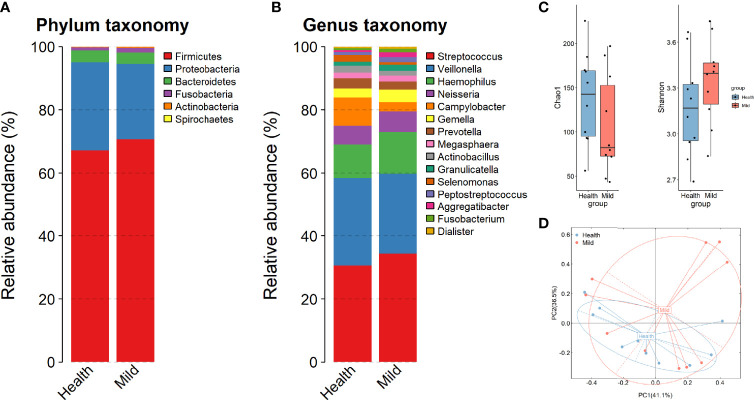
Figure 1.
Changes in microbial composition in mild COVID-19 patients compared to healthy controls. (A, B) Relative abundance of the top bacteria at the phylum and genus levels. (C) Chao1 diversity and Shannon biodiversity plot between healthy and SARS-CoV-2 (mild) individuals. (D) Bray–Curtis analysis of bacterial community composition diversity between healthy and SARS-CoV-2 samples.

