Figure 3.
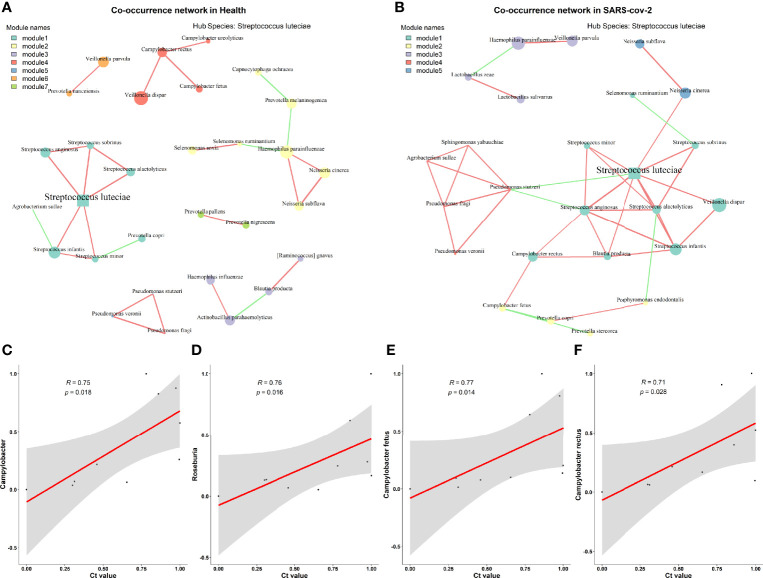
Microbial correlation network between healthy and mild SARS-CoV-2 patients. (A) Healthy controls. (B) SARS-CoV-2 patient. (C–F) Relationships between Ct. values and the differential taxa identified between higher and lower SARS-CoV-2 viral titer groups at the genus level (C, D) and species level (E, F).

