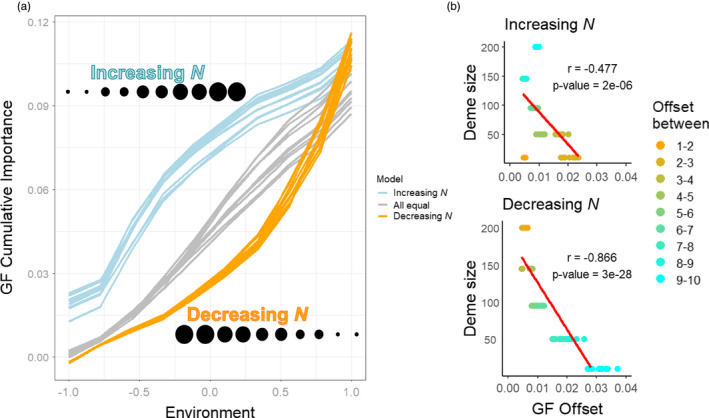
FIGURE 1.

Results of neutral simulations, where no selective pressure is imposed by the underlying environmental clines. (a) The relationship between GF cumulative importance and environment across increasing, decreasing, and equal deme sizes across the environmental gradient. GF Offset increased comparatively more when deme sizes were small. (b). A strong negative linear Pearson's correlation between the GF Offset and deme size in 10 replicates, regardless of the direction of the population gradient. Numbers 1 through 10 in the legend represent the columns in the metapopulation matrix (see Figure S1)
