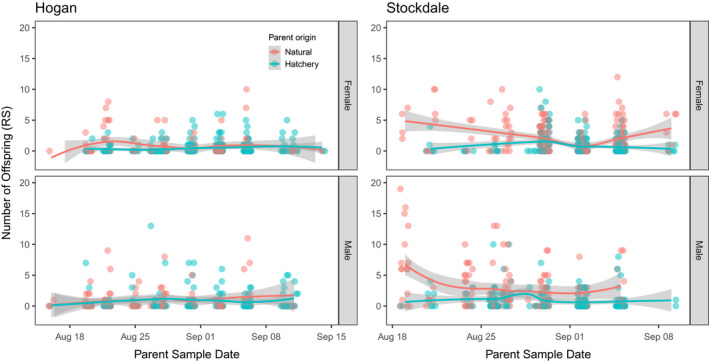
FIGURE 4.

Association between reproductive success (RS) and parent sample date for Hogan Bay (Hogan) and Stockdale Creek (Stockdale) in 2014. Data for females are shown in the top plots and males in the bottom plots. Lines represent LOESS (locally weighted scatterplot smoothing) best fit with shaded areas representing 95% confidence intervals (CIs). Points are jittered on the x‐axis to prevent overplotting. Note different x‐axis scales for the two streams. While RS was variable across parent sample dates, mean RS was higher for natural‐origin fish toward the beginning and end of the run, particularly for Stockdale Creek
