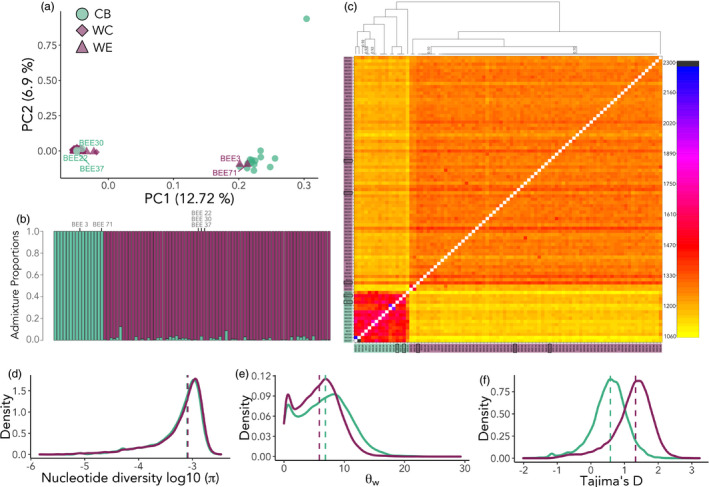
FIGURE 2.

Population structure and genetic diversity of B. terrestris individuals (n = 89). (a) principal components analysis (PCA) where two primary clusters are defined; the commercial bees (CB) group forms its own cluster, and the wild experimental (WE) and wild control (WC) groups cluster together (wild bees—‘WB’). Two WB individuals cluster with the CB group (i.e., ‘escapees’). Three CB individuals cluster with the WB group (i.e., ‘drifters’). (b) Genetic admixture for each individual sample shows K = 2. Cluster 1 (green, CB) comprises commercial bees and cluster 2 (purple, WB) comprises wild individuals. Individuals considered to be escapes and drifters are marked on the plot. (c) Simple co‐ancestry matrix visualized as a heatmap generated by fineSTRUCTURE and CHROMOPAINTER. The colour of each cell in the matrix shows the number of expected shared genetic chunks copied from a donor genome (column) to a recipient genome (row). Individuals considered to be escapes and drifters are marked on the plot with boxes around the sample name. Support for the branches on the co‐ancestry tree are 1, unless stated otherwise on the plot. (d) Nucleotide diversity (π) on a log10 scale; (e) Watterson's theta (θw); (f) Tajima's D for the CB (green) group and WB (purple) group. Dashed lines represent medians
