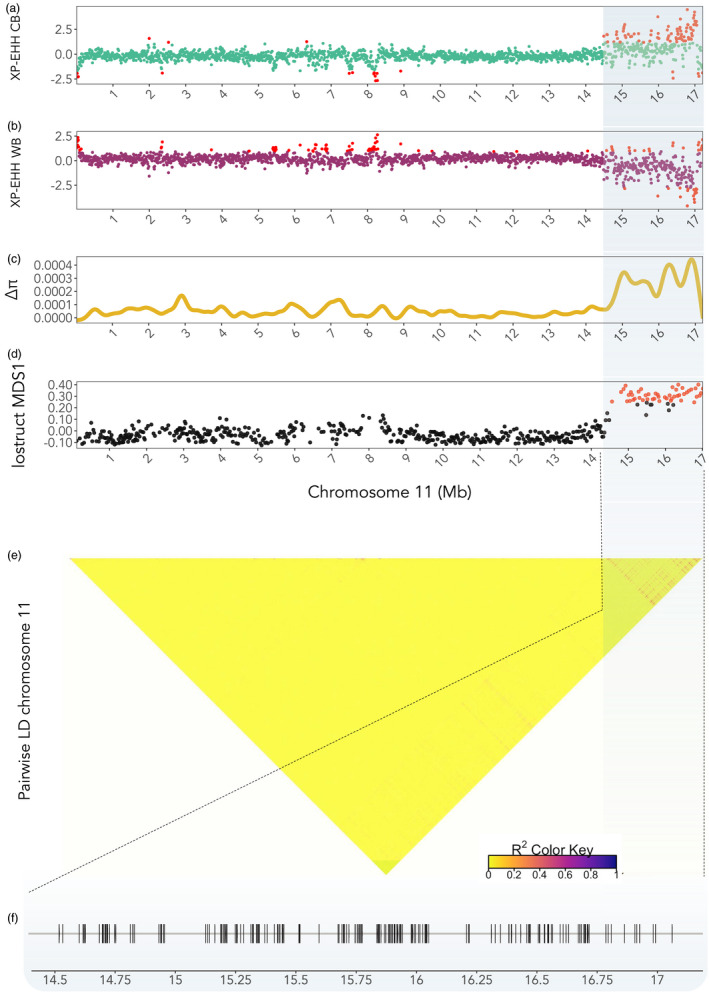
FIGURE 4.

(a) standard mean XP‐EHH scores for chromosome 11 for CB, and (b) for WB; (c) Delta nucleotide diversity along chromosome 11; red SNPs indicate the upper 99% and lower 1% confidence intervals; (d) Multidimensional scaling (MDS) plot of chromosome 11. Each point represents a window where the red points show windows with increased genetic differentiation from the rest of the chromosome; (e) pairwise linkage disequilibrium (LD) heatmap, calculated using r squared. Blue highlights the region containing SNPs with increased differentiation, or the SNPs in high LD (e); (f) annotated genes (n = 178) for outlier SNPs on chromosome 11
