FIGURE 7.

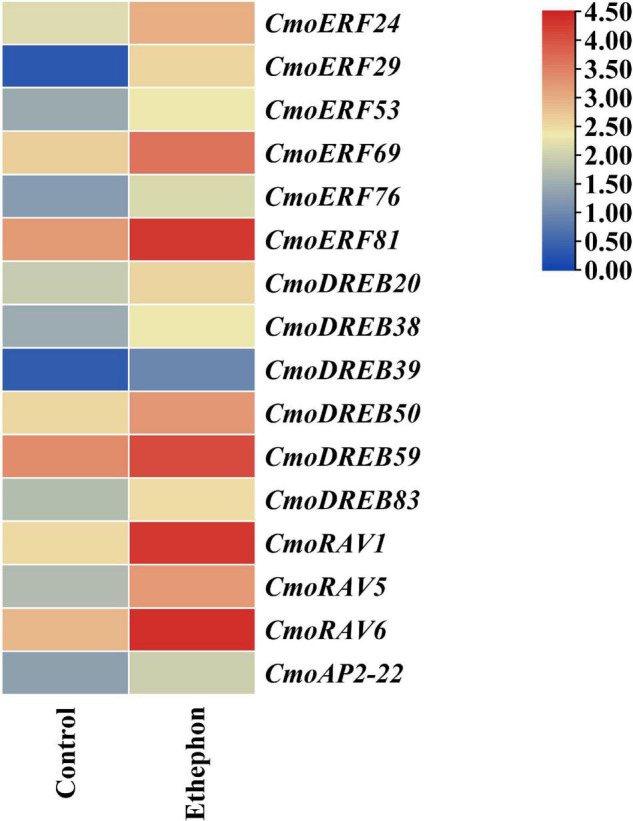
The expression pattern of sixteen CmoAP2/ERF genes in response to ethephon treatment in Cucurbita moschata. Expression levels are normalized according to the FPKM and the color scale refers to the deduced FPKM value normalized with Log2.

The expression pattern of sixteen CmoAP2/ERF genes in response to ethephon treatment in Cucurbita moschata. Expression levels are normalized according to the FPKM and the color scale refers to the deduced FPKM value normalized with Log2.