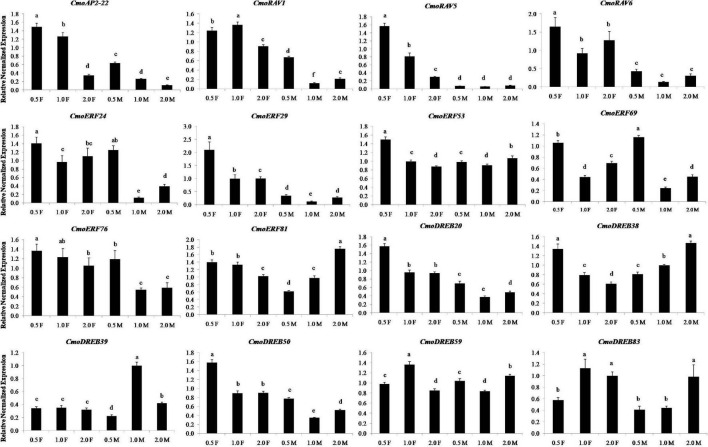
FIGURE 8.
The relative expression levels of the sixteen genes at different developmental stages of flowers in Cucurbita moschata. 0.5, 1.0, and 2.0 represent the vertical diameter of flowers and they were measured in centimeters. The F and M represent female flower and male flower, respectively. Relative expression levels are shown as the mean ± SD from three replications. Different letters in a column indicate significant differences between the stages at p < 0.05 level.

