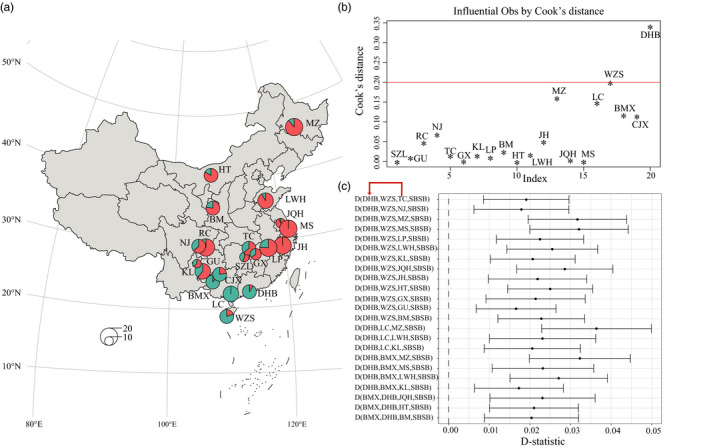
FIGURE 3.

Genetic evidence of hybridization of DHB. (a) Genetic structure of pig breeds for K = 2. The average ancestral composition of each breed was averaged for all individuals of the breed. The sample size of the breed determined the size of the pie chart. (b) Cook's distance identified DHB as the most influential outliers in the regression model. The red line indicates the threshold of 4/n, where n is the number of breeds. (c) D‐statistic analysis with D (DHB, small‐sized breeds, large‐sized breeds, SBSB) (y‐axis) for detection introgression from large‐sized breeds into DHB. Four small‐sized breeds and 15 large‐sized breeds formed 60 D‐statistic test combinations
