
FIGURE 2.
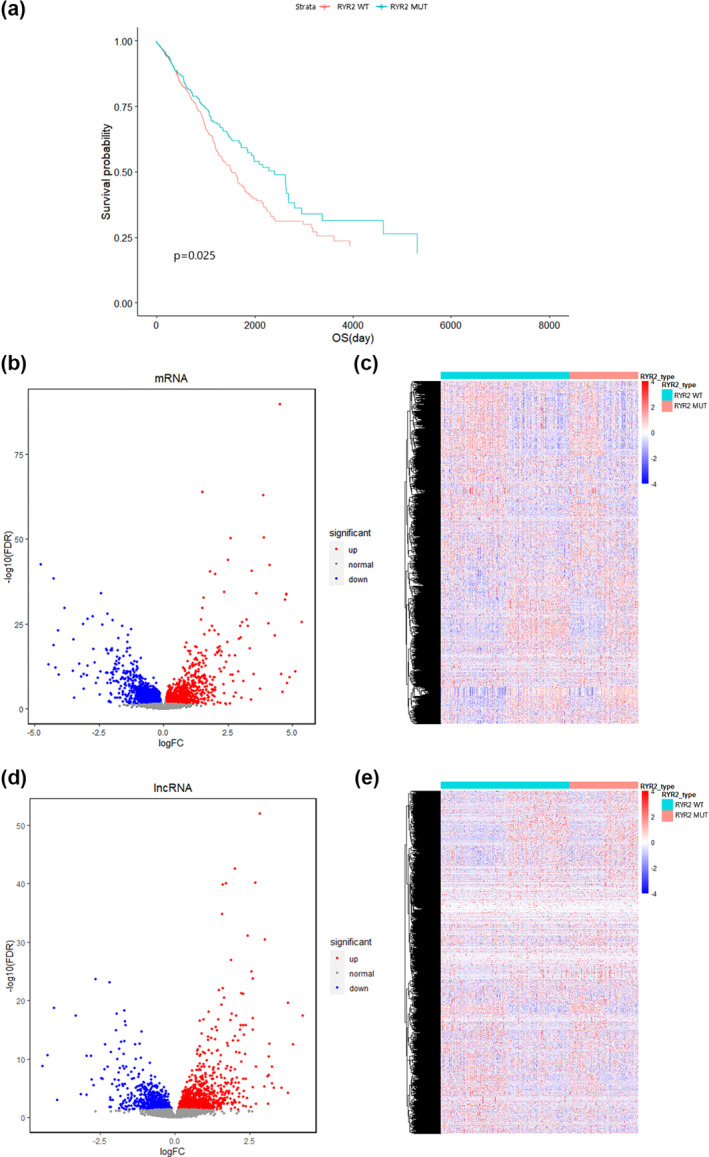
Overall survival and DEGs of RYR2 mutant group and wild group. (a) Kaplan‐Meier curve comparison of survival times between RYR2 wild‐type and mutant groups. (b, c) volcano plot (b) and heat map (c) of DEmRNAs obtained by “edgeR” analysis. (d, e): volcano plot (d) and heat map (e) of DElncRNAs obtained by “edgeR” analysis. DEGs, differentially expressed genes; DElncRNAs, differentially expressed lncRNAs; DEmRNAs, differentially expressed mRNAs; FC, fold change; FDR, false discovery rate; RYR2 WT, RYR2 wild‐type; RYR2 MUT, RYR2 mutant