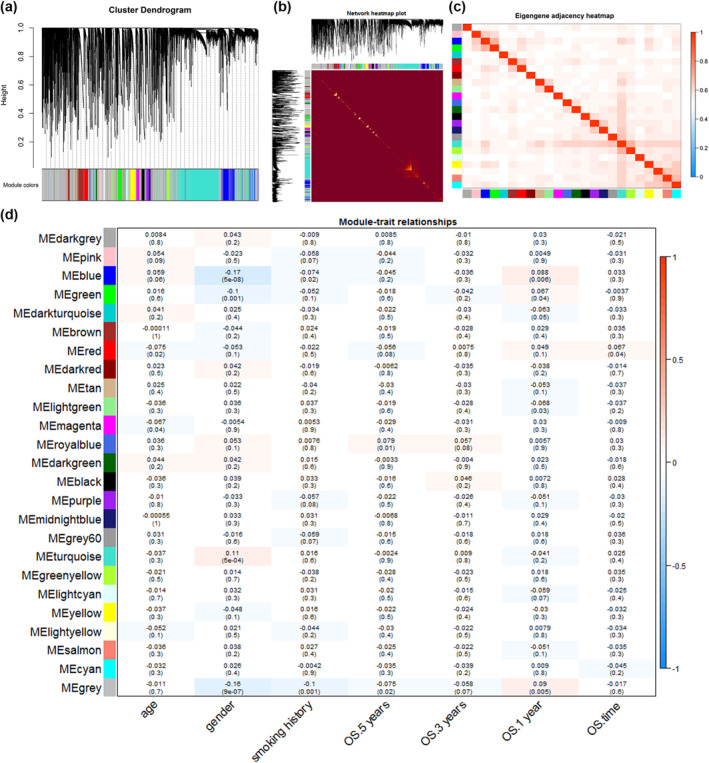
FIGURE 4.

Network construction and module‐trait relationships of co‐expressed genes. (a) Clustered dendrograms and co‐expression network modules generated by topologically overlapping DEGs based on average linkage hierarchical clustering. Each branch in the tree diagram represents a gene. Euclidean distances are highly depicted. Each colour indicates a different co‐expression module. (b) Heat map of topological overlap. Yellow areas represent high levels of topological overlap. (c) Heat map of feature gene adjacency. The heat map shows the correlation between different co‐expression modules. (d) Module‐trait relationship. Each row is a specific module and each column is a clinical feature. The R 2 and p values (in parentheses) for the Pearson correlations of modules with clinical traits were shown in the squares. Gradient colour ranging from −1 to 1 represent the R2‐values of Pearson correlations. ME, module eigengene; OS, overall survival
