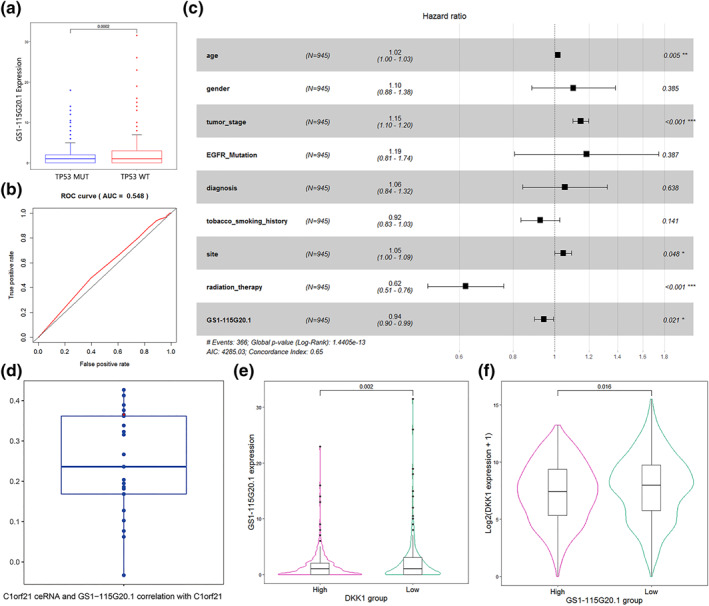
FIGURE 10.

GS1‐115G20.1 is an independent prognostic factor. (a) Low expression of GS1‐115G20.1 in the TP53 mutant group and high expression of GS1‐115G20.1 in the TP53 wild group. (b) ROC curves of high and low GS1‐115G20.1 expression to predict 3 year survival in NSCLC patients. (c) Results of multivariate Cox regression analysis with GS1‐115G20.1 as an independent prognostic factor. (d) Correlation analysis of ceRNAs of C1ORF1, GS1‐115G20.1 and C1ORF21 expression. The red point in the graph is GS1‐115G20.1 (p = 2.2e‐16). (e) Expression changes of GS1‐115G20.1 at different DKK1 expression levels. (f) Expression changes of DKK1 at different GS1‐115G20.1 expression levels
