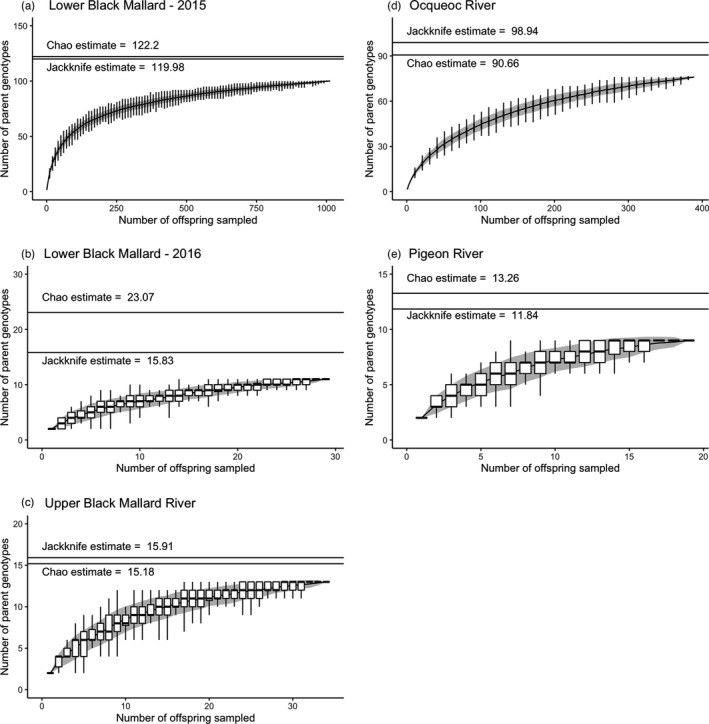
FIGURE 6.

The estimated number of different parental genotypes in the pedigree () characterized using pedigree accumulation curves for all three stream systems. For all locations, boxplot distributions for each step size overlay a line plot with a gray background for +/‐ one standard error, and labeled horizontal lines represent estimates from the jackknife and chao methods. Due to the large number of individuals, the Ocqueoc River boxplots are plotted in step sizes of 5 sampled individuals and the Lower Black Mallard River boxplots are shown for sample sizes increasing by 10 individuals. The boxplots for all other locations are plotted for a step size of 1 sampled individual
