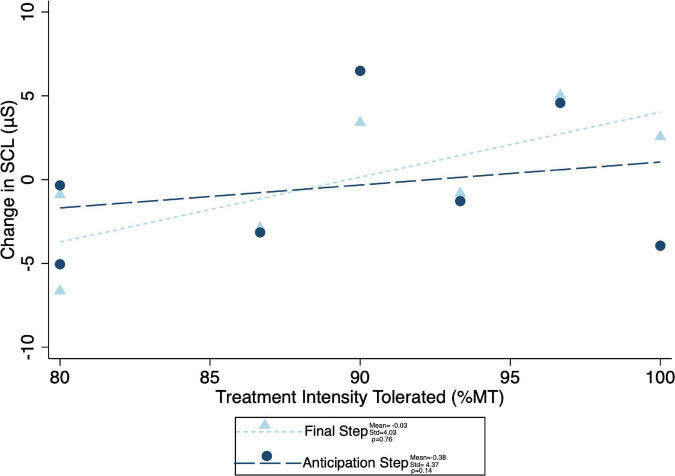
FIGURE 9.
Correlation between maximum treatment intensity tolerated and both anticipation step and mean final common step skin conductance level change (difference in mean skin conductance during the final step that was completed during both the pre- and post-treatment BATs). Change in SCL was calculated as pre minus post, with positive values indicating a decrease in SCL with treatment. Mean change in SCL, standard of deviation of the SCL change, and spearman correlation coefficient (ρ) for both anticipation and final common steps shown.

