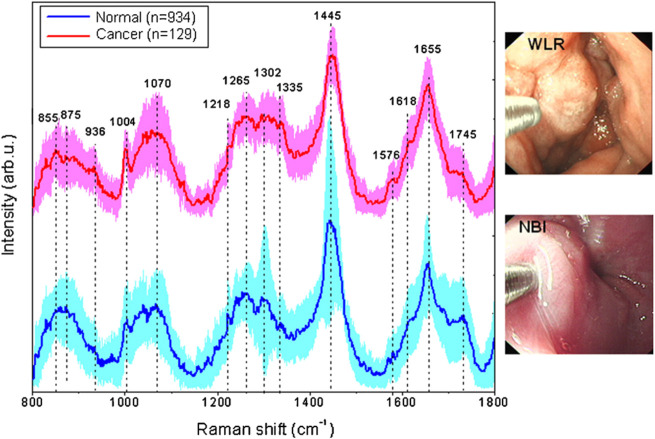
FIGURE 5.
In vivo mean Raman spectra ±1 standard deviations (SD) of normal (n = 934), and cancer (n = 129) gastric tissue, as well as the corresponding white-light reflectance (WLR) image and narrow-band image (NBI) acquired during clinical gastroscopic examination. Reproduced from permission (Huang et al., 2010b). Copyright (2010), with permission from Elsevier.

