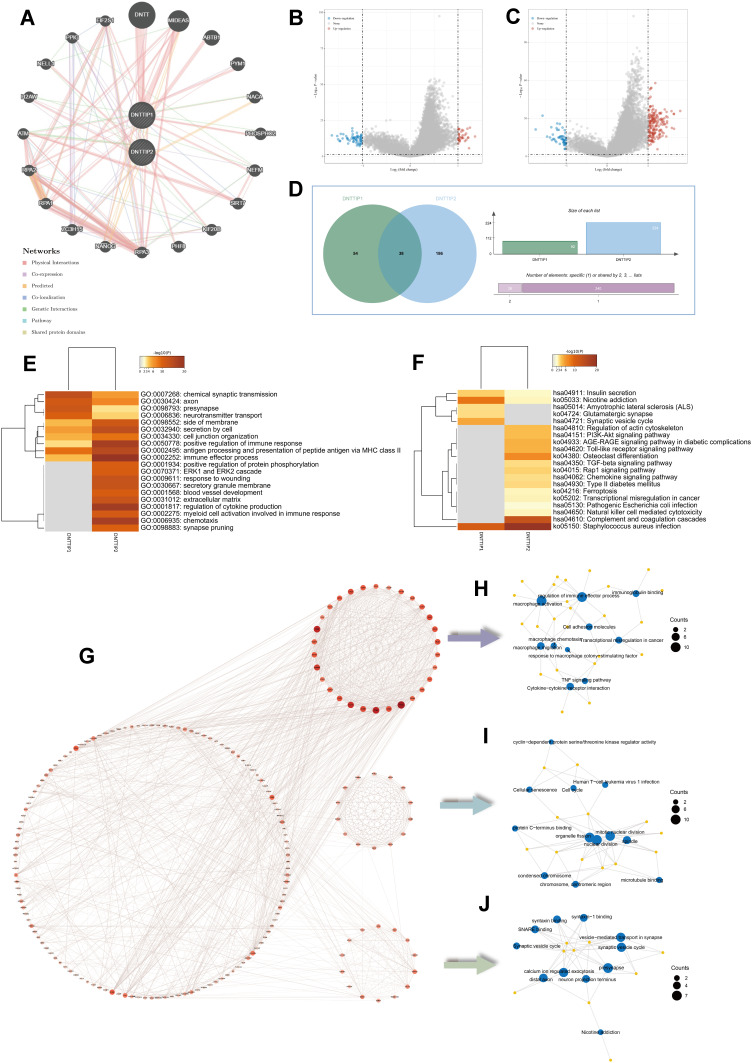
Figure 3.
Enrichment analysis of DNTTIP1/2 and correlated genes. (A) GeneMINIA-based protein–protein interactions (PPI) with DNTTIP1/2 as the core. (B and C) Differences in DNTTIP1/2 expression in the low- and high-expression groups were analyzed using the “Limma” R package on The Cancer Genome Atlas (TCGA) dataset after which volcano plots were constructed. Red dots indicate positive correlations, green dots indicate negative correlations, and gray dots indicate that genes that did not correlate with DNTTIP1/2. (B) DNTTIP1; (C) DNTTIP2. (D) The “VennDiagram” R package was used to analyze correlations of common genes with DNTTIP1 and DNTTIP2. (E and F) Gene ontology (GO) (E) and Kyoto Encyclopedia of Genes and Genomes (KEGG) (F) enrichment analysis of DNTTIP1/2. Each row represents one cluster; color indicates significance, and gray color indicates non-significance. Heatmap showing the top 20 clusters correlated with DNTTIP1/2. (G) Network of DNTTIP2 and genes with DNTTIP2-linked expression (positive). (H–J) The hub module with the highest scores analyzed by Molecular Complex Detection (MCODE).

