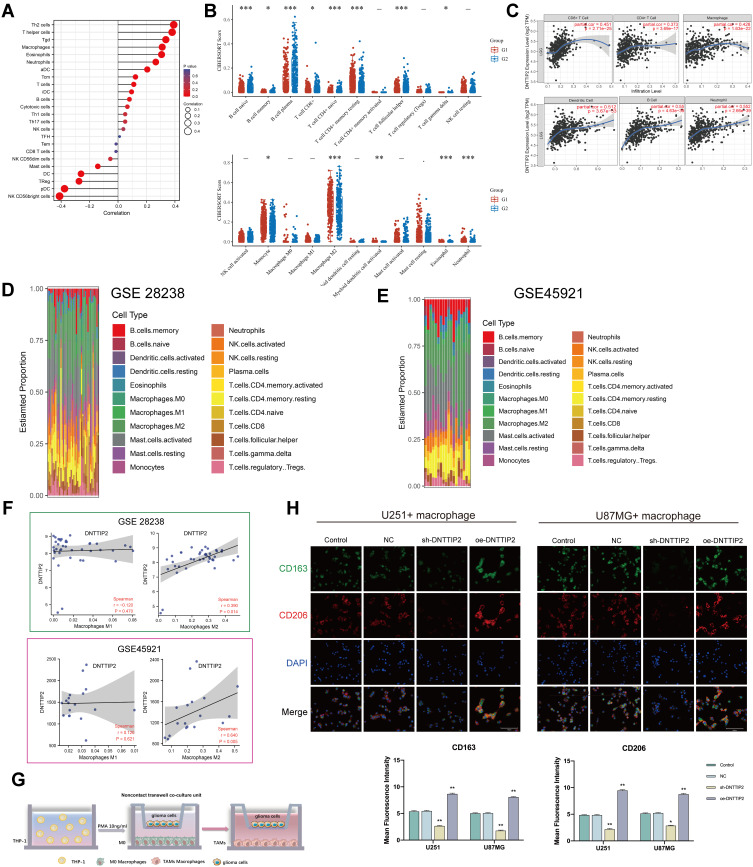
Figure 5.
Immune landscape of LGG patients with different expression levels of DNTTIP2. (A) Spearman correlation between DNTTIP2 and 24 types of immune cells. Positive (red lollipop) and negative (blue lollipop) correlations. (B) Correlation between DNTTIP2 expression and immune cell infiltration, where the x-axis indicates the type of immune cell and the y-axis indicates the immune score (CIBERSORT scores) in different groups where different colors represent different groups. High-expression group (red) and low-expression group (blue). (C) Correlation between DNTTIP2 expression and immune cell numbers analyzed by TIMER. (D and E) Proportions of the TIC types in LGG samples based on (D) GSE28238 and (E) GSE45921. (F) Correlation of DNTTIP2 expression levels with macrophage abundance based on GSE28238 and GSE45921. (G) Diagram of co-culture system. (H) Double-immunofluorescence staining of M2 macrophage markers CD206 (red) and CD163 (green); nuclei are stained with DAPI (blue). Intensity of immunofluorescence (mean ± SEM). Data are means ± SEM *p<0.05; **p <0.01; ***p< 0.001.

