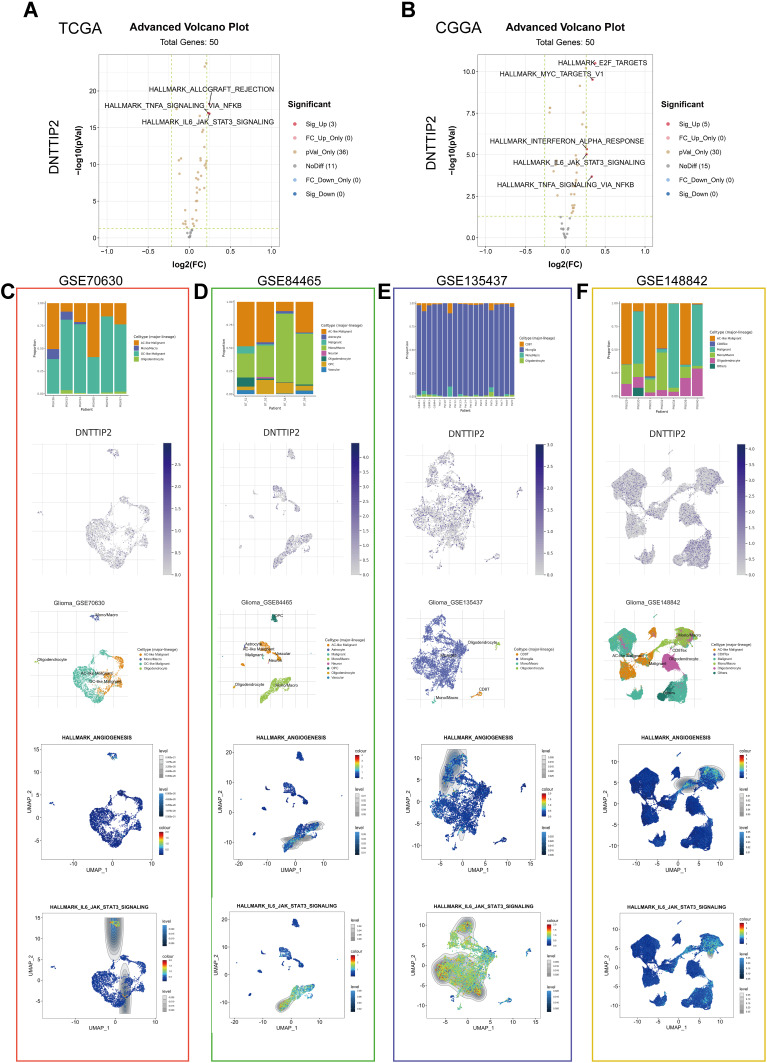
Figure 6.
Gene Set Variation Analysis (GSVA) and Single-cell level analysis of DNTTIP2. (A and B) Volcano plot of the differentially enriched genesets in LGG patients with different expression of DNTTIP1/2 in (TCGA) and (CCGA) dataset was analyzed by GSVA ((A) TCGA; (B) CCGA). Blue nodes indicate down-regulation, red indicates up-regulation, yellow indicates significance, and gray indicates non-significance. (C–F) Single-cell analysis of DNTTIP2 based on four single-cell RNA‐seq datasets. (C) GSE70630; (D) GSE84465; (E) GSE135437; (F) GSE148842. Uniform manifold approximation and projection (UMAP) plots illustrating the expression of DNTTIP2 clusters. UMAP plots illustrating the LGG cell landscape. Different cell types across all cells after quality control, dimensionality reduction, and clustering. Enrichment score for genes from the Hallmark gene set in each cell, obtained using gene set variation analysis.

