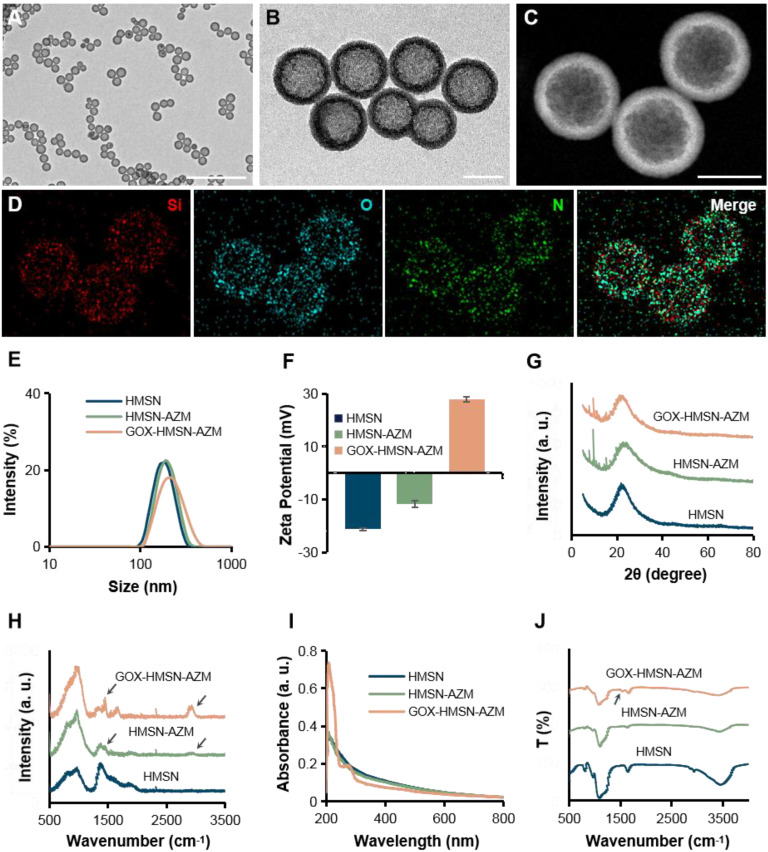
Figure 1.
Characterization of GOX-HMSN-AZM. (A-B) Representative TEM images of HMSN and GOX-HMSN-AZM. Scale bar = 1μm and 100 nm, respectively. (C) The high-angle annular dark-field (HAADF) stem image of GOX-HMSN-AZM. (D) Elemental mapping (Si, O, N, Merge) of GOX-HMSN-AZM. (E) Hydrodynamic diameter distribution and (F) Zeta potential of HMSN, HMSN-AZM and GOX-HMSN-AZM measured by dynamic light, respectively. (G) XRD patterns, (H) Raman spectra, (I) UV-vis-NIR absorption spectrum, and (J) FTIR spectra of HMSN, HMSN-AZM and GOX-HMSN-AZM, respectively.

