Figure 2.
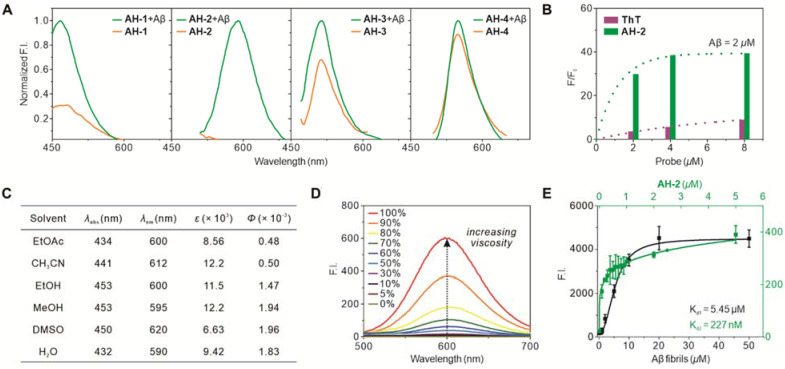
Photophysical characterization of Aβ fibrils-specific response of AH-2. (A) Fluorescence-response of probes AH-1—AH-4 to Aβ fibrils. The concentrations of probes were kept at 5 µM, while that of Aβ fibrils was kept at 2.5 µM. The fluorescence spectra of each probe before binding Aβ fibrils were normalized to its emission after the treatment of Aβ fibrils. (B) Fluorescence increment of probe AH-2 (at 587 nm) in comparison to ThT (at 480 nm) in response to Aβ fibrils. Each probe was kept at 2, 4, or 8 µM; Aβ fibrils were kept at 2 µM. F was the intensity of the probe treated with Aβ fibrils; while F0 was the probe intensity at the indicated concentration without Aβ fibrils treatment. (C) Photophysical property of AH-2 in solvents of various polarities. (D) Fluorescence spectra of AH-2 in PBS with various proportional glycerol to adjusting solution viscosity. (E) Binding affinity plot between AH-2 and Aβ fibrils. Kd1 plot was carried out by setting AH-2 at a fixed concentration of 100 nM and varying concentrations of Aβ (1-42) aggregates. Kd2 plot was carried out by setting Aβ (1-42) aggregates at a fixed concentration of 100 nM and varying concentrations of AH-2. Data in A, B, and D were recorded on a fluorescent spectrometry while those in E were recorded on a microplate reader.

