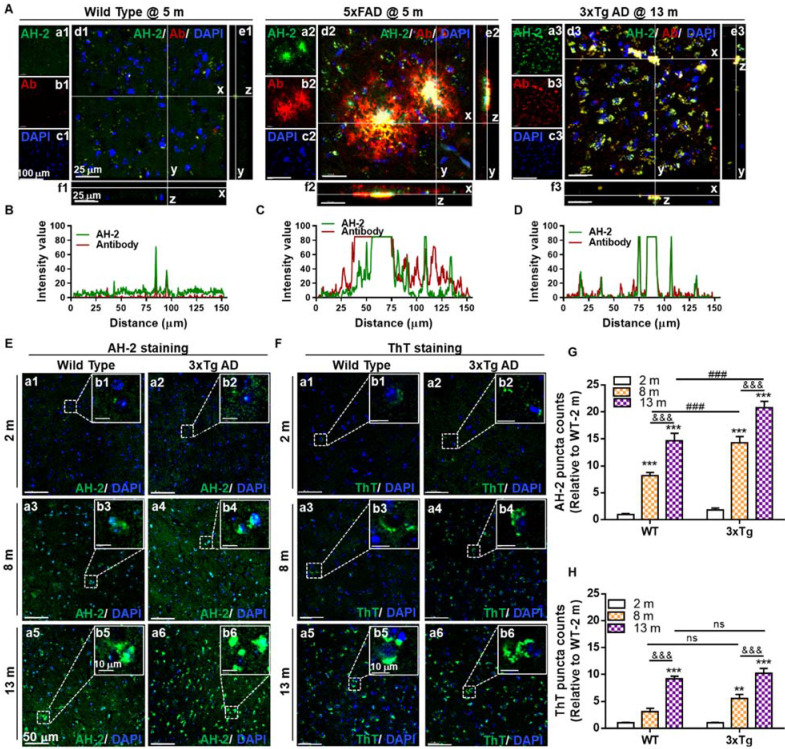
Figure 3.
Specificity and sensitivity test for probe AH-2 to Aβ deposits in mice brain slices. (A) Representative confocal images of Aβ deposits labelled by AH-2 and Aβ1-42/1-40 antibody in the brain cortex of wild-type mice, 5xFAD mice, and 3xTg AD mice. The orthogonal projections of Z-stack images (d1-d3) to y-z (e1-e3) and x-z (f1-f3) further demonstrated the co-localization of AH-2 signal and Aβ antibody signal. (B-D) The fluorescence distributions of Aβ antibody signal (red line) and AH-2 signal (green line) along line x in d1-d3. (E, F) Representative images of AH-2 (E) and ThT (F) staining age-dependent Aβ accumulation in the cortex of wild-type mice and 3xTg mice at ages of 2, 8, and 13 months. Magnified images of boxed regions were displayed in images b1-b6 respectively. (G, H) Quantification of AH-2 or ThT-labeled Aβ deposits in the cortex of wild-type and 3xTg AD mice. Data were expressed as Mean ± SEM normalized to WT at 2 months. **p < 0.01, ***p < 0.001 versus 2 months group. &&& p < 0.001 versus 8 months group. ###p < 0.001 versus age-matched WT group. ns, no significance. N = 5 mice. AH-2: green channel, λex = 488 nm, λem = 595 nm; Aβ1-42/1-40 antibody: red channel, λex = 640 nm, λem = 700 nm. Cell nuclei indicated by DAPI: blue channel, λex = 405 nm, λem = 450 nm.

