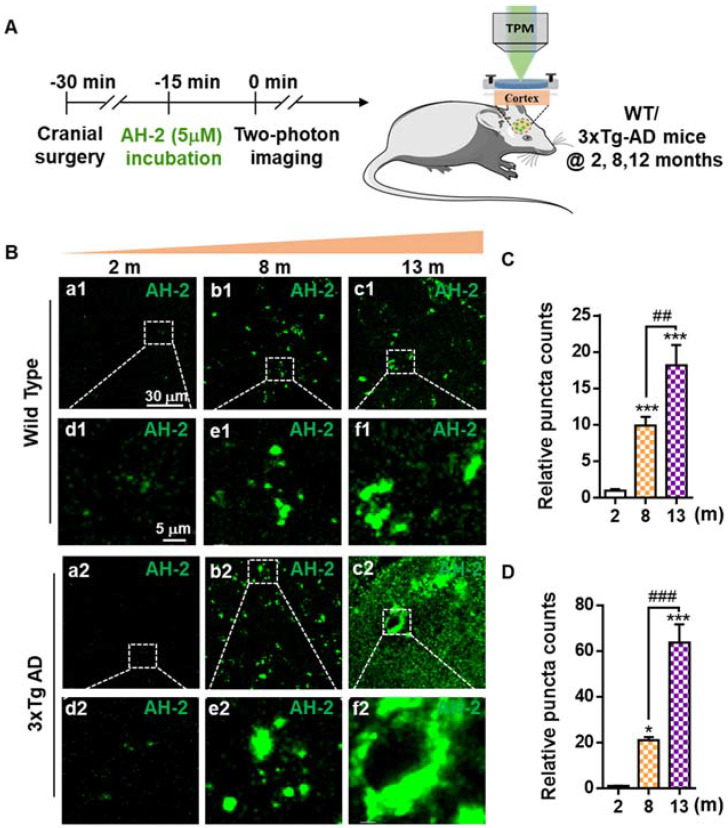
Figure 4.
Two-photon in vivo imaging of Aβ deposits in the brains of live mice. (A) Schematic diagram of AH-2 application in vivo with two-photon imaging. (B) Images of AH-2 fluorescence-indicated Aβ deposits acquired from the brain cortex of aging wild-type mice and 3xTg AD mice. AH-2 signal was collected at 580 nm upon the two-photon excitation at 860 nm in the brains of live mice. Representative boxed regions were magnified and displayed in the bottom panel. (C, D) Quantitative analysis of AH-2 labeled Aβ puncta in wild-type and 3xTg AD mice at ages ranging from 2 months to 13 months. The data were expressed as Mean ± SEM. *p < 0.001, ***p < 0.001 versus 2 months group. ##p < 0.01, ###p < 0.001 compared to 8 months group. N = 5 mice.

