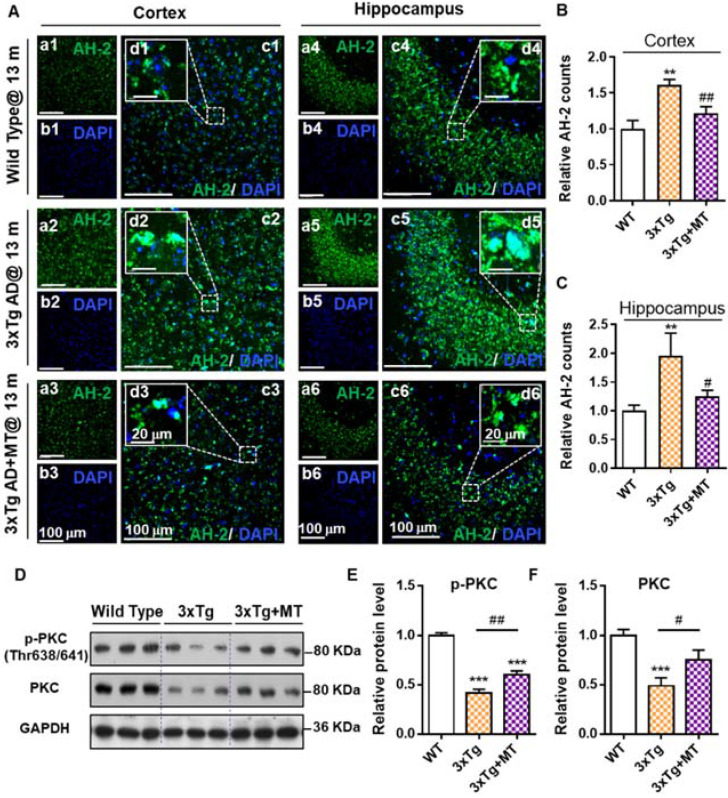
Figure 5.
AH-2 imaging revealed melatonin-induced reduction of Aβ deposits in AD mice brain. (A) Representative confocal images of AH-2 tracked Aβ aggregation changes in the cortex (left) and hippocampus (right) of aged wild-type mice (upper panel), 3xTg AD mice (middle panel), and melatonin-treated 3xTg AD mice (bottom panel). AH-2 signal (green) was collected at 595 nm upon laser excitation at 488 nm. Magnified images (d1-d6) of white-box regions showed the expression patterns of Aβ aggregation around the DAPI (blue)-indicated nuclei. Scale bar = 100 µm (a-c). Scale bar = 20 µm (d). (B, C) Effect of melatonin on Aβ aggregation in the cortex (B) and hippocampus (C) was measured and quantified as the counts of AH-2 positive puncta. All data were normalized to the wild-type group and presented as Mean ± SEM. **p < 0.01 versus wild type group. #p < 0.05, ##p < 0.01 versus 3xTg AD group. (D) Representative Western blot bands of cognition-related proteins p-PKC and PKC expression analysis in the hippocampus from wild type and 3xTg AD mice with and without melatonin treatment. GAPDH worked as sample load control for the blots. (E, F) Protein levels in each group were measured by Image J and shown as the ratio of the WT group. Data were expressed as Mean ± SEM. **p < 0.05, ***p < 0.001 versus WT group. #p < 0.05, ##p < 0.01 versus 3xTg group. N = 6 mice.

