Figure 1.
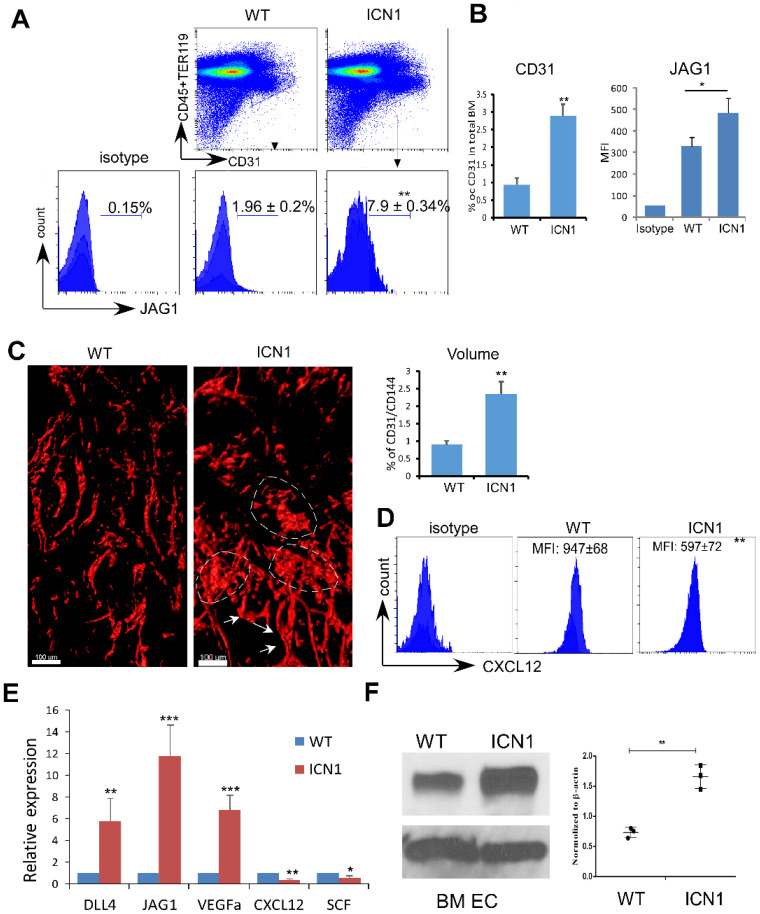
T-ALL Development Induced Up-regulation of JAG1 and Down-regulation of SCF and CXCL12 in ECs. (A-B) Representative FACS profile of bone marrow ECs (Lin-TER119-CD31+) and EC-expressing JAG1 (A). Frequency of bone marrow CD31+ ECs and mean MFI of JAG1 determined from 4 similar experiments (B). (C) Representative whole-mount imaging of CD31/CD144+ bone marrow vasculature in the control WT and ICN1 mice (left panel). Dilated small arteries and coalesced vessels were highlighted by arrows and dotted circles, respectively. Right panels plot the changes in CD31/CD144 volume (%) by whole-mount imaging. (D) Representative EC (CD45-TER119-CD31+) expression of CXCL12 by FACS analysis in control mice or in ICN1 leukemia mice. Mean MFIs were calculated from 4 similar experiments. (E) BMECs were co-cultured with control or ICN1 cells (1.5 X10⁶) for 24h. qRT-PCR of EC expressions of transcripts were standardized for beta-actin and expressed as fold changes relative to those in EC co-cultured with control marrow cells (n=6/group from 2 experiments). (F) Representative western blot (left) with anti-JAG1 of BMECs co-cultured with control or ICN1 cells. Quantification of JAG1 expression normalized to β-actin from 3 similar experiments (right). Data shown in A, B, C (right), D-F are mean ± SD (n=3-6/group from 2-4 experiments). Student t test was performed; *p<0.05; ** p<0.01.

