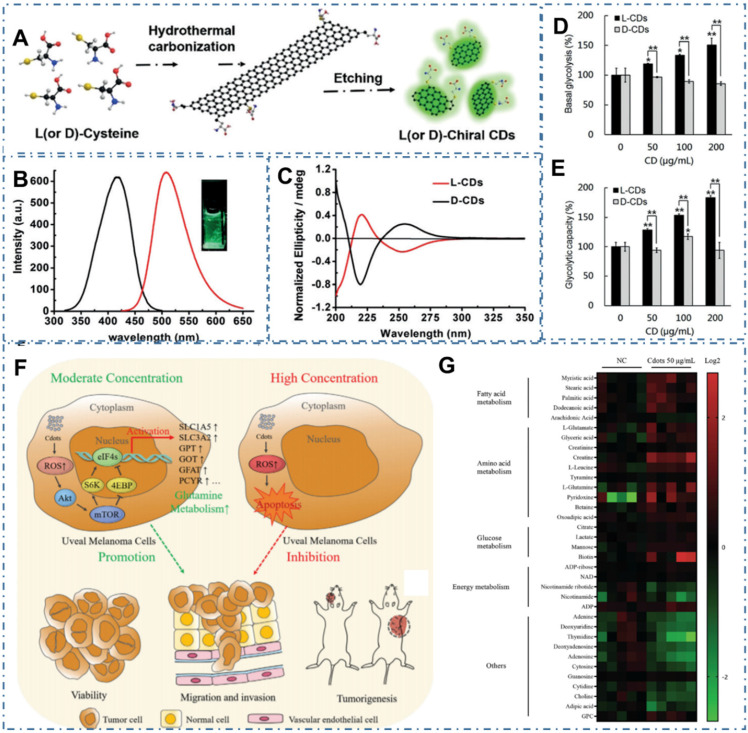
Figure 19.
CDs-based cancer therapy by cell metabolism effect. (A) Synthesis of chiral CDs by hydrothermal treatment of chiral cysteines. (B) PL excitation and emission spectrum of the L-CDs. (C) Circular dichroism spectra of the L-and D-CDs. (D) Basal Glycolysis from the extracellular acidification rate curves. (E) glycolytic capacity. Adapted with permission from 232, copyright 2018Wiley-VCH Verlag GmbH &Co. KGaA, Weinheim. (F) Schematic of the opposing CDs-concentration-dependent effects on tumor cell progression and metastasis. (g) Heatmap depicting changes in metabolite concentration between control and 50 µg mL-1 CDs-treated Mum2B cells (p < 0.05). Adapted with permission from 233, copyright 2021 Wiley-VCH GmbH.

