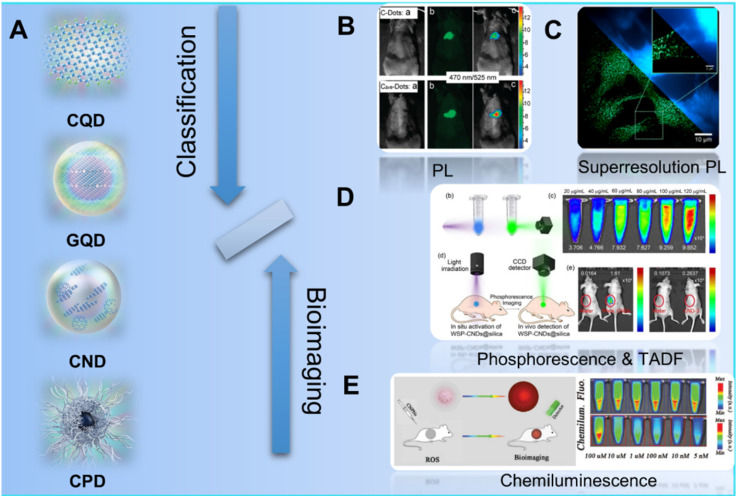
Figure 3.
Schematic illustration of the classification of CDs and their different kinds of luminescence models for bioimaging. (A) The classification of CQDs, GQDs, CNDs and CPDs for different CDs. Adapted with permission from 69, copyright 2019 WILEY‐VCH Verlag GmbH & Co. KGaA, Weinheim. (B) Schematic illustration of the PL bioimaging. Adapted with permission from 80, copyright 2009, American Chemical Society. (C) Schematic illustration of the bioimaging via superresolution PL. Adapted with permission from 91, copyright 2018, American Chemical Society. (D) Schematic illustration of the bioimaging by phosphorescence and TADF. Adapted with permission from 143, copyright 2020 Elsevier Ltd. (E) Schematic illustration of the bioimaging with CL. Adapted with permission from 167, copyright 2019 WILEY‐VCH Verlag GmbH & Co. KGaA, Weinheim.

