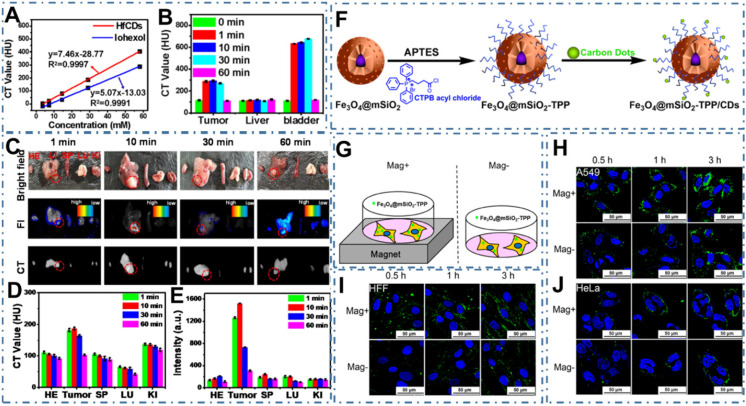
Figure 4.
CDs-based targeted bioimaging through uptake accumulation. (A) CT value of Hf-CDs/iohexol aqueous solution at different concentrations. (B) CT values of major organs collected at different times after intravenous injection of Hf-CDs. (C) Ex vivo bright field, FI and CT images of major organs collected at different intervals post tail vein injection of Hf-CDs. (D) Quantitative analysis of the CT values. (E) Quantitative analysis of the FI intensity. Adapted with permission from 184, copyright 2020 Elsevier Ltd. (F) Schematic route of the synthesis of Fe3O4@mSiO2-TPP/CDs nanoplatform. (G) Illustration of the cells exposed to the Fe3O4@mSiO2-TPP NPs while positioned or not in a static magnetic field. (H)-(J) CLSM images of the A549 (I), HFF (J), and HeLa (K) cell lines treated with the Fe3O4@mSiO2-TPP NPs for different time under Mag+ or Mag-. Adapted with permission from 185, copyright 2015 American Chemical Society.

