. 2022 Mar 11;4(2):e210067. doi: 10.1148/rycan.210067

Figure 4:

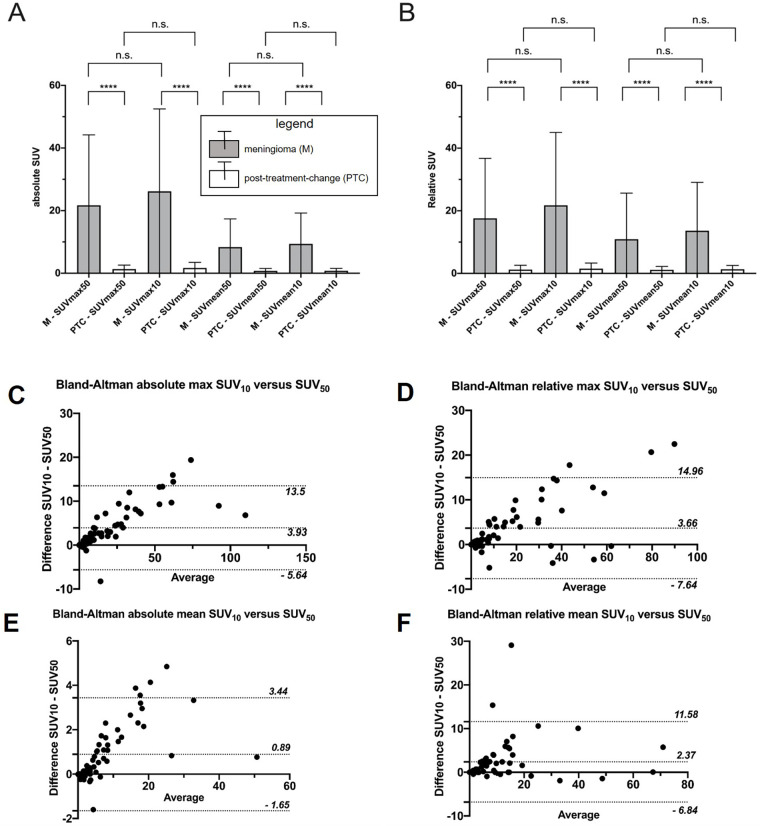
Comparison of meningioma and posttreatment-change lesions using maximum and mean standardized uptake value (SUV) measured over the entire scan period versus the last 10 minutes. Shown are mean and SD of each of the four types of SUV metrics. (A) Maximum and mean absolute SUV and (B) relative maximum and mean SUV (normalized to the superior sagittal sinus).**** indicates P value less than .001. (C–F) The respective Bland-Altman plots including both meningioma and posttreatment-change regions in the same chart with most SUV10−SUV50 differences being positive and lying within the plotted 95% CIs. n.s. = not significant, SUV10 = SUV extracted from the last 10 minutes of acquisition, SUV50= SUV extracted from the entire 50 minutes of acquisition.

Comparison of meningioma and posttreatment-change lesions using maximum and mean standardized uptake value (SUV) measured over the entire scan period versus the last 10 minutes. Shown are mean and SD of each of the four types of SUV metrics. (A) Maximum and mean absolute SUV and (B) relative maximum and mean SUV (normalized to the superior sagittal sinus). **** indicates P value less than .001. (C–F) The respective Bland-Altman plots including both meningioma and posttreatment-change regions in the same chart with most SUV10−SUV50 differences being positive and lying within the plotted 95% CIs. n.s. = not significant, SUV10 = SUV extracted from the last 10 minutes of acquisition, SUV50= SUV extracted from the entire 50 minutes of acquisition.