. 2022 Mar 11;4(2):e210067. doi: 10.1148/rycan.210067

Figure 7:

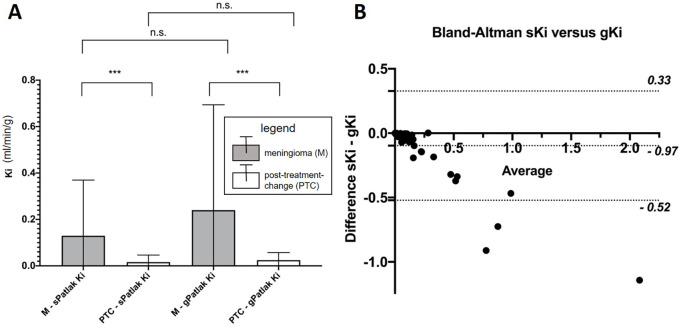
(A) Comparison of meningioma and posttreatment-change lesions using standard (sPatlak) and generalized (gPatlak) Ki scores. Shown are mean and standard deviation. *** indicates P value less than .001. (B) Respective Bland-Altman plot including both meningioma and posttreatment change regions in the same chart with most sKi-gKi differences being negative and lying within the plotted 95% CIs. gKi = gPatlak Ki, Ki = net binding rate constant, n.s. = not significant, sKi = sPatlak Ki.

(A) Comparison of meningioma and posttreatment-change lesions using standard (sPatlak) and generalized (gPatlak) Ki scores. Shown are mean and standard deviation. *** indicates P value less than .001. (B) Respective Bland-Altman plot including both meningioma and posttreatment change regions in the same chart with most sKi-gKi differences being negative and lying within the plotted 95% CIs. gKi = gPatlak Ki, Ki = net binding rate constant, n.s. = not significant, sKi = sPatlak K i.