
Figure 8:
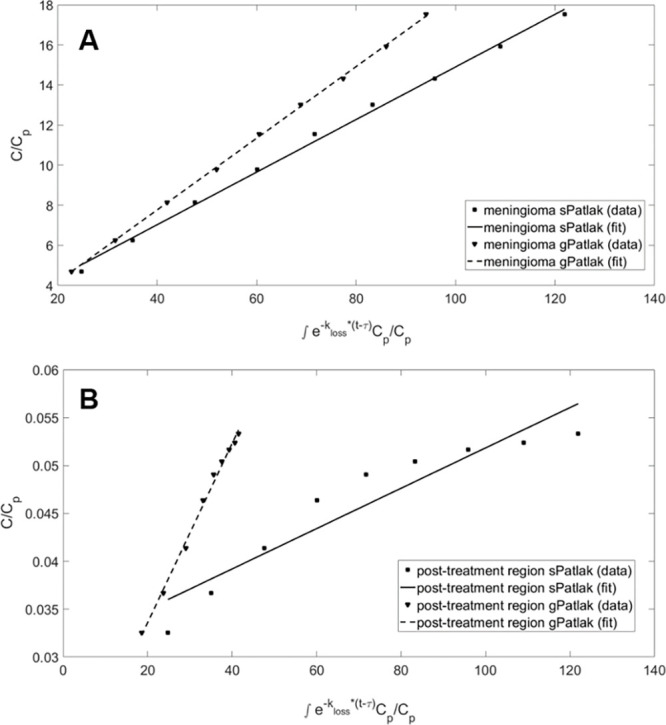
Graphical analysis of standard Patlak (sPatlak) (kloss= 0) and generalized Patlak (gPatlak) (kloss≥ 0) plots of 68Ga-DOTATATE dynamic uptake in a (A) meningioma and (B) posttreatment-change regions from a single participant examination. Although the different dynamic 68Ga-DOTATATE uptake patterns illustrated for this participant between meningioma and posttreatment change may suggest a higher efflux rate constant for posttreatment change, no evidence of a difference in the efflux rate constant was observed between meningioma and posttreatment change across the volumes of interest evaluated in this study. C = radiotracer activity concentration in tissue, Cp= radiotracer activity concentration in reference tissue, DOTATATE = tetraazacyclododecane tetraacetic acid octreotate, 68Ga = gallium 68, kloss = radiotracer deassociation rate constant, τ = time after injection to attain kinetic equilibrium and enter linear region in the Patlak plot.