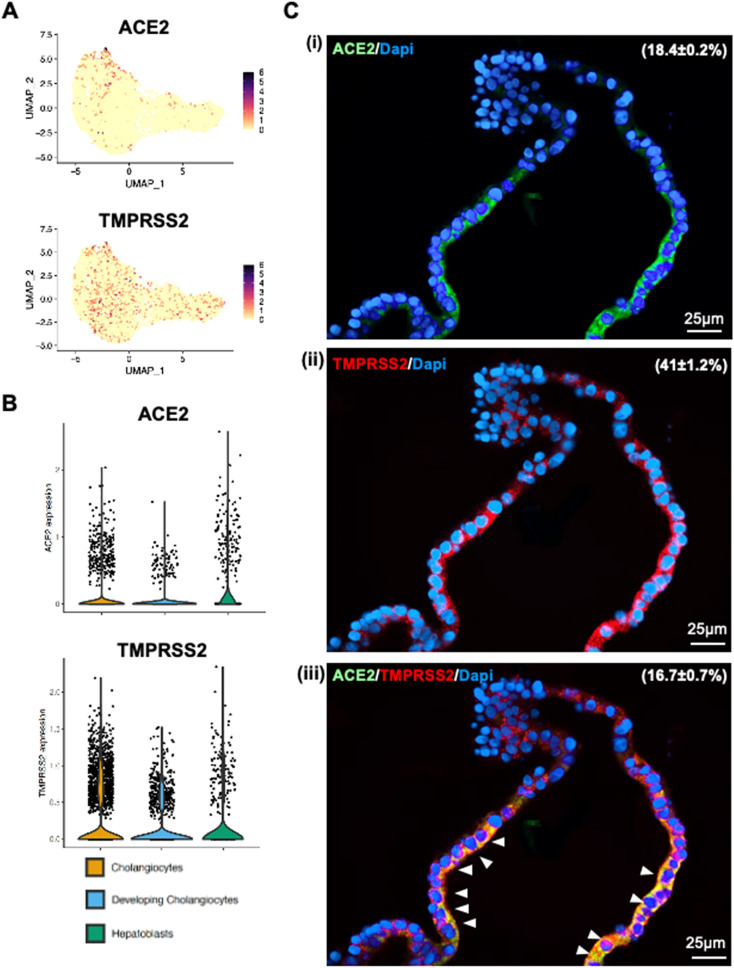
Figure 2.
Human liver organoid cells expressed ACE2 and TMPRS2. (A) and (B) Feature plot and violin plot displaying single cell expression distributions for features (ACE2, TMPRSS2 and TMPRSS4) in each cluster of cells from liver organoids. (C) Co-immunofluorescence staining of human liver organoids for ACE2 and TMPRSS2. Parenthesis indicated the percentages of organoid cells that expressed ACE2 (i), TMPRSS2 (ii) and ACE2 plus TMPRSS2 (iii). Arrowheads, organoid cells that co-expressed ACE2 and TMPRSS2.

