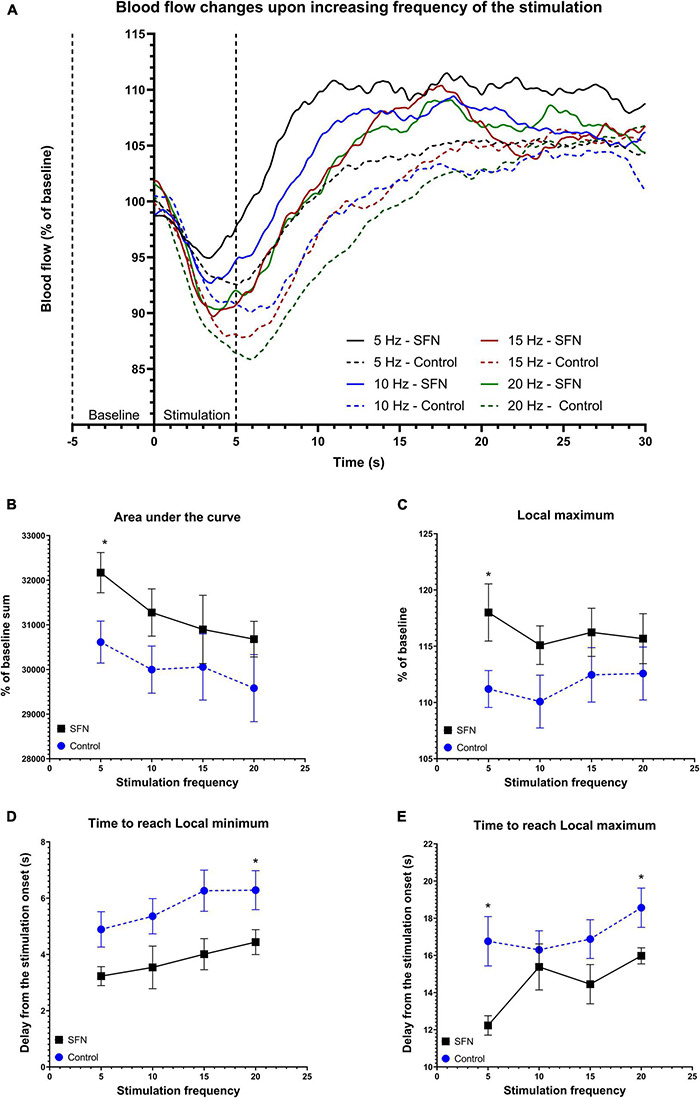
FIGURE 7.

SFN pretreatment improved blood flow and accelerated response to the electrical stimulation of increasing frequency. Baseline was calculated as average of values from 5 s before the stimulation to its onset. The average value at any given time (smoothed line) for each frequency and group is shown panel (A). Dotted lines denote the beginning of baseline measurement and end of stimulation. Parameters that had shown SFN as a significant factor on two-way ANOVA are shown panels (B–E). We observe increased AUC (B) suggesting increased total blood flow during the 30 s period, increased Lmax (C), and quicker response as shown when comparing both time to reach Lmin (D) and Lmax (E). Multiple unpaired t-tests were run to compare values at each frequency, significant results are denoted by an asterisk. All values (B–E) are reported as mean ± SEM (*P < 0.05).
