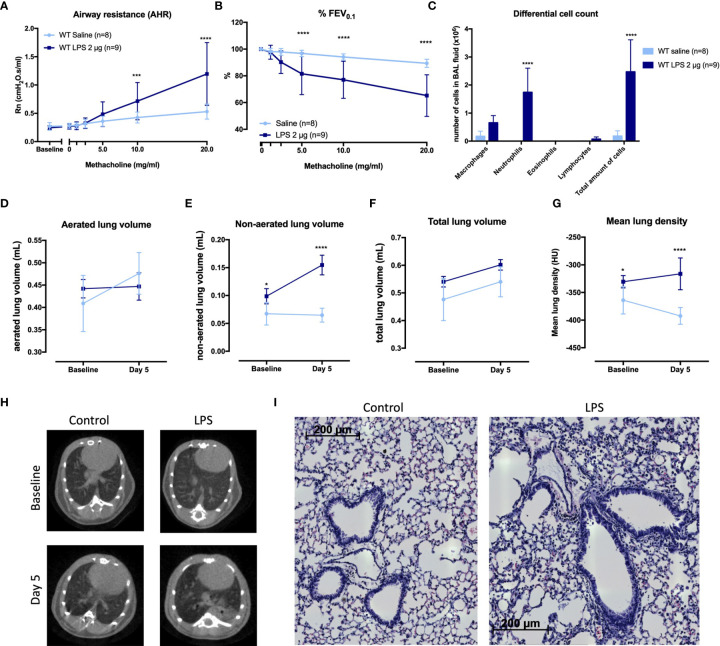
Figure 1.
Characterization of a murine model for neutrophilic asthma. BALB/c wild-type (WT) mice were challenged with LPS (2 µg in 50 µl saline) via the nose on four consecutive days ( Supplementary Figure 1A ). Twenty-four hours after the last challenge with LPS, lung function parameters were measured with the FlexiVent and µCT was performed. Airway resistance [Rn, (A)] and FEV0.1 [%, (B)] before and after methacholine provocation (0–20 mg/ml) were measured in saline-treated mice (n = 8) and LPS-treated mice (n = 9) and a differential cell count (C) was performed on BAL fluid. Results from two independent experiments were combined. µCT-derived biomarkers were measured in saline-treated mice (light blue; n = 5) and LPS-treated mice (dark blue; n = 5): the aerated lung volume (D), non-aerated lung volume (E), total lung volume (F), and mean lung density (G). Representative µCT images at baseline (before saline or LPS challenges) and at day 5 are shown in (H) for control (saline-treated) mice and LPS-treated mice. Representative images of hematoxylin and eosin staining of lung tissue of saline-exposed and LPS-exposed mice at day 5 are shown in (I) (magnification ×40). Data are represented as mean with standard deviation. Two-way ANOVA was used to compare groups. *p < 0.05; ***p < 0.001; ****p < 0.0001. HU, Hounsfield unit; LPS, lipopolysaccharide.

