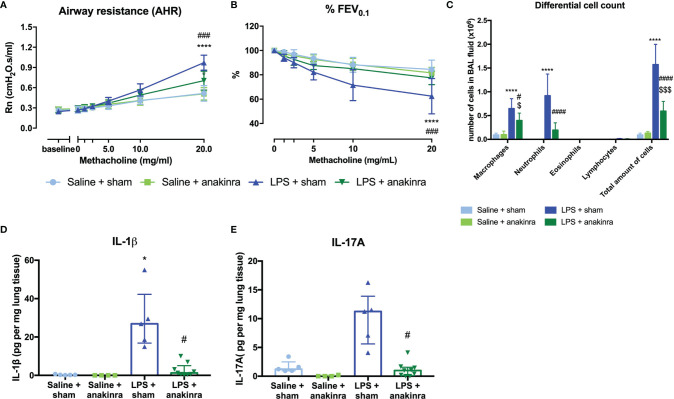
Figure 6.
Effect of anakinra in the LPS model. SCID mice were endonasally treated with anakinra (50 μl of a 20 mg/ml solution) on days -1, 1, and 3 together with the four endonasal challenges with LPS (2 µg in 50 µl saline), as shown in Supplementary Figure 1C . Twenty-four hours after the last challenge with LPS, lung function parameters were measured using the FlexiVent, and BAL fluid was obtained for differential cell count and lung tissue for cytokine analysis. Airway resistance [Rn, (A)] and FEV0.1 [%, (B)] before and after methacholine provocation (0–20 mg/ml) were measured in saline + sham-treated mice (n = 7), saline + anakinra-treated mice (n = 7), LPS + sham-treated mice (n = 7) and LPS + anakinra-treated mice (n = 7). Differential cell count in BAL fluid is shown in (C). Lung IL-1β and IL-17A levels corrected for lung weight are shown in (D, E) in the different groups. Data are represented as mean with standard deviation in (A–C) and as individual values with median and interquartile range in (D, E). Two-way ANOVA was used in (A–C) and Kruskal–Wallis with Dunn’s post hoc test was used to calculate the p-values. *p < 0.05; ****p < 0.0001 (saline + sham versus LPS + sham). #p < 0.05; ###p < 0.001; ####p < 0.0001 (LPS + sham versus LPS + anakinra). $p < 0.05; $$$p < 0.001 (saline + anakinra versus LPS + anakinra).

